- Select a language for the TTS:
- UK English Female
- UK English Male
- US English Female
- US English Male
- Australian Female
- Australian Male
- Language selected: (auto detect) - EN
Play all audios:
ABSTRACT PURPOSE The visual standard to hold a UK driver's license since 2012 includes visual acuity (VA) measured indoors and the ability to read a car numberplate outdoors.
Individuals with reduced contrast sensitivity may have greater visual difficulties outdoors. The agreement between the two tests in the presence of combined reduction in contrast sensitivity
and VA was investigated. METHODS Simulation glasses (‘sim-specs’) were used to reduce both high-contrast VA and contrast sensitivity (CS). Following evaluation of the influence of sim-specs
on VA and CS, levels 2 to 4 were chosen to give a range of VAs on either side of the driving standard of 6/12. Sixty-two participants wearing sim-specs then had VA tested with Snellen and
ETDRS charts indoors, and ability to read a numberplate assessed outdoors as per DVLA regulations. RESULTS Sim-specs reduced VA and CS by ~0.10 logMAR VA per 0.10 logCS. The sensitivity of
test chart VA <6/12 to correctly predict failure on the numberplate was 61% for Snellen and 56% for ETDRS. CONCLUSION False-negative and -positive rates were higher than in a previous
study with uncorrected refractive error only. Reduced CS increased the lack of agreement between the two driving vision standards, which likely occurs as the VA test is performed indoors and
the numberplate test outdoors. The increased likelihood of failing the numberplate test even though VA is 6/12 or better needs to be considered when advising patients on fitness to drive
who have ocular disease such as cataract. SIMILAR CONTENT BEING VIEWED BY OTHERS MESOPIC CONDITIONS OPTIMISE THE DETECTION OF VISUAL FUNCTION LOSS IN DRIVERS WITH SIMULATED MEDIA OPACITY
Article Open access 01 August 2022 DISCREPANCY AND AGREEMENT BETWEEN SUBJECTIVE SYMPTOMS AND VISUAL FIELD IMPAIRMENT IN GLAUCOMA PATIENTS AT A DRIVING ASSESSMENT CLINIC Article Open access
02 January 2025 NEAR VISION DATA AND NEAR CORRECTION REQUIREMENTS FROM COMMUNITY EYE HEALTH PROGRAMMES IN NINE COUNTRIES Article Open access 22 January 2024 INTRODUCTION To hold a valid
driver’s license in the UK motorists currently have to meet two different visual acuity (VA) standards: correctly read a post-2001 style car registration plate (‘numberplate’) in outdoor
conditions and achieve 6/12 Snellen on a test chart.1 The latter standard was introduced in May 2012 to bring the UK into line with an EU directive on driving licensure.2 The directive gives
guidance on the licensing of motorists so that the requirements to hold a license are consistent across Europe. The interpretation of the directive and its application in law is at the
discretion of each country. The DVLA in the UK gives no guidance on the measurement of ‘6/12 Snellen’ in terms of test chart type and scoring, whereas the methods for assessing the
numberplate test are more detailed, in terms of the test conditions, viewing distance and that all figures have to be correctly read for the numberplate to be ‘passed’. The addition of the
second standard complicates advising motorists of their suitability to drive. Where two visual tasks are different, perfect agreement between the two measures would not be expected and we
have previously found this to be the case for people with uncorrected refractive error.3 The agreement between the standards is complicated by one test being performed indoors in the clinic
environment with consistent light levels, and the other outdoors where light intensity will be higher and more variable depending on environmental conditions, with an increased likelihood of
glare sources. Disability glare increases with opacification of the ocular media such as with cataract, resulting from light scatter,4 which casts a veiling luminance and reduces light
sensitivity at the retina. The effects of glare in outdoors conditions does not relate consistently to visual performance indoors.5 Contrast sensitivity (CS) testing has been proposed as an
additional method for assessing visual function relating to ‘real world’ activities with particular applications in patients with ocular disease.6 For example, with conditions affecting the
clarity of the ocular media such as cataract, reductions in high-contrast VA and CS are usually found in combination,7 thus a patient with borderline vision for driving due to the presence
of ocular disease (rather than just uncorrected refractive error) is likely to also suffer from a loss of CS. CS testing is not required for the UK driving regulations but is mentioned in
the EU directive, which states that where there is doubt as to the ability to achieve the driving standards, that a person should be examined by a ‘competent medical authority’ with
consideration to glare and CS, amongst other tests. This study investigated how the ability to achieve both driving vision standards—seeing 6/12 on an indoor test chart and correctly reading
a car numberplate outdoors—is affected in the presence of both reduced VA and CS. High-contrast VA was reduced to around the pass–fail point for driving where there is uncertainty as to
whether both visual standards for driving will be achieved using simulation glasses, which also reduce CS. The likelihood of passing one but not both standards in the presence of reduced CS
was quantified. MATERIALS AND METHODS NORMATIVE DATA Cambridge simulation glasses8 (‘sim-specs’) were used to reduce high-contrast VA and CS in combination. These have been developed to aid
inclusive design for individuals with visual impairment. The sim-specs create light scatter and multiple pairs can be worn to create varying levels of visual impairment. A normative study
was first conducted to determine the level of sim-specs to be used to reduce VA to levels on either side of the driving standard of 6/12. A previous study3 has shown uncertainty in the
ability to achieve a numberplate pass with Snellen VAs in the range of 6/9 to 6/36. 30 participants (mean age 34.9±12.7, 16 males, 14 females) took part in the normative study. Each had
high-contrast VA measured with an ETDRS logMAR chart9 at 3 m scored on a letter by letter basis10 and CS was assessed with the Pelli Robson chart at 1 m, scored in logCS on a letter by
letter basis.11 With logMAR VA scoring, a lower number indicates better VA and with logCS scoring, a lower score represents poorer CS. For both charts, participants wore any refractive
correction required and were measured with no sim-specs and then sim-specs in each of levels 2, 3, and 4. This allowed sim-specs to be chosen for the main study which would reduce VA to a
target range on either side of the driving standard of 6/12 where there is likely to be lack of agreement between the two driving vision standards. DRIVING VISION TESTS The ability to meet
both the driving vision standards was then assessed in 62 participants (mean age 25.3±11.2, 26 males, 36 females) with sim-specs in levels 2 to 4 to give a range of visual performance. For
38 participants, measurements were made with one level of sim-specs and for 24 participants two different levels were used. High-contrast VA was measured indoors in a well-lit clinical
examination room with an ETDRS style logMAR chart and a Snellen layout chart, both viewed at 6 m via a mirror (Thomson Test Chart 2000 XPert software, version 11.09; Thomson Software
Solutions, Hatfield, Herts, UK). The ETDRS chart presents 5 × 5 proportioned Sloan letters12 with five letters on each row and consistent spacing. The Snellen chart presents 5 × 4 British
letters13 with a variable number of letters per line, from one letter at 6/60 to eight at 6/5. The 6/12 line had five letters. ETDRS VA was scored on a letter by letter basis10 and Snellen
as the last whole line correctly read. The Snellen chart is still commonly found in clinic settings and GP and optometric practices and is traditionally scored on a ‘whole line’ basis. The
ETDRS chart is increasingly used in research and clinic settings where more precise measures of VA are required which can be obtained by the letter by letter scoring method. The numberplate
test was conducted outdoors at 20 m in accordance with DVLA regulations1 and scored as a ‘pass’ if all the figures on one plate were correctly read. Three attempts were given for plates with
a yellow background with different letter and number combinations, as per the regulations. All participants gave written informed consent to participate and ethical approval for the study
was obtained from Anglia Ruskin University. The study adhered to the tenets of the Declaration of Helsinki. We certify that all applicable institutional and governmental regulations
concerning the ethical use of human volunteers were followed during this research. RESULTS NORMATIVE SIM-SPEC DATA The normative data for the reduction in VA and CS from baseline levels with
sim-spec in levels 2 to 4 shown in Table 1. LogMAR and logCS reductions are given in relation to the ‘no sim-spec’ condition. There was a consistent reduction in both VA and CS with
increasing levels of sim-specs. The relationship between sim-spec level and VA is given by the regression equation VA=(0.19 × sim-spec level) −0.34 with an _R_2 of 0.99, and between sim-spec
level and CS (CS) by the equation CS=(−0.28 × sim-spec level)+2.01, also with an _R_2 of 0.99. There was a significant correlation between the reduction in VA and CS (Pearson correlation:
_r_=−0.751; _P_<0.001) with ~0.10 logMAR reduction in VA for each 0.10 logCS reduction in CS. DRIVING VISION TESTS To compare the two driving standards, sensitivity and specificity were
calculated, as there was a continuum of VA scores but a pass/fail on the numberplate. A true positive was taken as VA worse than 6/12 or +0.30 logMAR correctly predicting a numberplate fail.
A false positive indicated not achieving 6/12 or +0.30 logMAR but passing the numberplate, whereas a false negative occurred where 6/12 or +0.30 logMAR is achieved, yet the numberplate test
was failed. A true negative indicated a pass on both tests. An ‘overlap zone’ was defined as the range of acuities within which there was uncertainty as to whether both driving standards
would be met or both failed, that is, the range of acuities where there were false positives or false negatives. Acuities better than the lower limit of the overlap zone predict a pass on
the numberplate and at those worse than the upper limit of the zone a fail is predicted. This approach was chosen as where there is uncertainty that the driving requirements will be met, VA
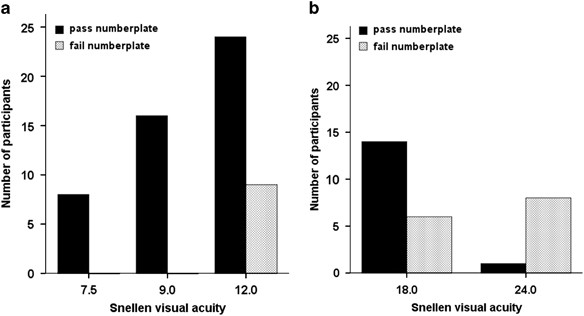
in the clinic setting is more often taken as an indicator as to whether the numberplate test would be passed. SNELLEN CHART The overlap-zone encompassing the range of VA where some
participants passed one, but failed the other test extended from 6/12 to 6/24 and included 62 measurements (Figure 1). Sensitivity for the Snellen VA correctly predicting a numberplate fail
was 61% and specificity 62%. Figure 1a shows those participants who would achieve the test chart driving standard when tested using a Snellen style chart but who may or may not meet the
numberplate standard (false-negative rate of 15%). Figure 1b shows those participants who failed to achieve the test chart driving standard for the Snellen chart but who may or may not meet
the numberplate standard (false-positive rate of 24%). ETDRS STYLE CHART The overlap zone for the ETDRS style chart is shown in Figure 2. The zone extended from +0.08 to +0.54 logMAR
(Snellen equivalent 6/7.2 to 6/20.7), with a sensitivity of 56% and specificity of 81% (Table 2). Figure 2a shows those participants who would achieve the test chart driving standard when
tested using an ETDRS chart but who may or may not meet the numberplate standard (false-negative rate of 13%). Figure 2b shows those participants who failed to achieve the test chart driving
standard for the ETDRS chart but who may or may not meet the numberplate standard (false-positive rate of 13%). DISCUSSION The ability to hold a driver's license is important for
mobility and maintaining independence. Reduced CS has been shown to be associated with crash involvement in some studies.14 In patients with cataract, reduced CS has been shown to be
associated with self regulation of driving and depressive symptoms.15 When advising patients on their ability to meet the driving vision standards, the likelihood that CS is reduced along
with VA needs to be considered. The sim-specs provided a useful tool to study the effects of both reduced high-contrast VA and reduced CS as they allow for controlled reduction of VA and CS
to desired levels. For this study, levels 2 to 4 yielded acuities in the target range on either side of the driving test chart standard of 6/12, from 6/7.5 to 6/24 for the Snellen chart and
0.00 to +0.68 logMAR for the ETDRS chart. Levels 3 and 4 (Table 1) gave a reduction in VA to levels comparable to ‘mild visual impairment’ in the International Statistical Classification of
Diseases.16 There was a consistent relationship between sim-spec level and change in VA and CS so that higher levels of sim-specs could be used to simulate more severe degrees of visual
impairment. The relationship between the amount of reduction of VA and CS of approximately 0.10 logMAR VA to 0.10 logCS is similar to that found in mild and moderate cataracts.17, 18 We have
previously investigated the agreement between the two driving vision standards3 in participants with uncorrected refractive error which reduces VA without significantly affecting CS.19 Our
previous study identified zones of overlap between the results of the two driving vision standards, extending from 6/9 to 6/36 for the Snellen chart and between +0.12 and +0.84 logMAR for an
ETDRS style chart. The extent of the overlap zones in the present study with the additional reduction in CS were similar (Figures 1 and 2) although the number of participants within the
overlap zone between the two standards was higher when CS was reduced. Good sensitivity of a clinical test is desirable such as where a clinic room test chart is used to predict numberplate
performance. This measure is dependent on the false-negative rate, which represents those people who may be able to achieve the 6/12 or +0.30 logMAR standard in the clinic room, yet would be
unable to pass the outdoor numberplate test (Figures 1 and 2a). Thus they could be incorrectly advised that they would meet the driving vision requirements on the basis of their test chart
acuity. In this study, sensitivity was reduced for both charts compared with our previous study,3 from 97 to 61% for the Snellen and from 91 to 56% for the ETDRS chart. The most notable
finding of the present study is that the addition of reduced CS along with reduced VA increases the false-negative rate from 2 to 15% for the Snellen chart and from 6 to 14% for the ETDRS
chart. Thus, a greater proportion of individuals with reduced CS could be potentially incorrectly advised as to their visual fitness to drive. The false-positive rate was similar to our
previous study3 for the ETDRS chart but increased from 15 to 24% for the Snellen chart. Individuals classified as false positives (Figures 1 and 2b) would have been able to meet the older UK
driving standard of seeing the numberplate alone but now fail to meet the complete standard since the introduction of the additional 6/12 criteria in 2012 in line with the EU directive.2
The differences in false-positive rate between the ETDRS and Snellen charts may relate to the difference in layouts with the Snellen chart having variable numbers of letters per line and the
lowest whole correct line being used for scoring. The letter by letter scoring adopted for the ETDRS chart gives credit for partially completed lines, which may increase VA from a bare fail
to a bare pass, therefore it is preferable for measuring driver’s VA as the false-positive rate is lower. The increase in false-positive and -negative rates with reduced CS highlights the
importance of environmental conditions when tests are performed outdoors in the presence of reduced CS, as would often be found in those patients with cataract. An interesting consideration
is that when the practical driving test is taken, it is the outdoor numberplate that is used to assess driver’s vision with a reliance on self report of Snellen acuity below 6/12. Average
age when taking the driving test in the UK is around 23 years.20 At this age, uncorrected refractive error is more likely to be reducing vision than ocular disease. License renewal is then
only required after age 70, or where referral for medical opinion on visual fitness to drive has been made by the DVLA such as when drivers report that they suffer from an ocular disease. In
this case it is more likely for visual acuities to be tested in an indoors clinic environment. Older drivers and those with ocular disease are much more likely to have reduced CS21, 22 and
so would have an increased chance of being false negatives who would actually fail the numberplate when tested outdoors. SUMMARY AND CONCLUSIONS The EU directive on driver’s licensing2 aimed
to standardise visual requirements to drive across Europe. The retention of the existing UK outdoor numberplate test (to facilitate testing by driving test examiners and police) along with
the additional test chart 6/12 requirement and the lack of perfect agreement between these two measures, means that some driver's are able to meet only one or other of the standards.
This study shows that the likelihood of this increases in the presence of reduced CS. Care needs to be exercised when giving an opinion on visual fitness to drive based only on test chart
visual acuities, especially with older patients and those with ocular disease such as cataract that are known to reduce CS. Some patients may not meet the criterion to access NHS funded
cataract surgery with VA at 6/12 or better, yet would fail to meet the full visual requirements to drive. REFERENCES * Driver and Vehicle Licensing Agency. At a glance guide to the current
medical standards of fitness to drive. Available at http://www.dft.gov.uk/dvla/medical/ataglance.aspx. Accessed on 3 November 2014. * European Parliament. Commission Directive 2009/113/EC of
25 August 2009 on amending Directive 2006/126/EC of the European Parliament and of the Council on driving licences. Available at
http://eur-lex.europa.eu/LexUriServ/LexUriServ.do?uri=OJ:L:2009:223:0031:0035:EN:PDF. Accessed 3 November 2014. * Latham K, Katsou MF, Rae S . Advising patients on visual fitness to drive:
implications of revised DVLA regulations. _Br J Ophthalmol_ 2015; 99: 545–548. Article Google Scholar * van den Berg TJ . Importance of pathological intraocular light scatter for visual
disability. _Doc Ophthalmol_ 1986; 61: 327–333. Article CAS Google Scholar * Abrahamsson M, Sjostrond J . Impairment of contrast sensitivity function (CSF) as a measure of disability
glare. _Invest Ophthalmol Vis Sci_ 1986; 27: 1131–1136. CAS PubMed Google Scholar * Owsley C, Sloane M . Contrast sensitivity, acuity, and the perception of 'real-world'
targets. _Br J Ophthalmol_ 1987; 71: 791–796. Article CAS Google Scholar * Hess R, Woo G . Vision through cataracts. _Invest Ophthalmol Vis Sci_ 1978; 17: 428–435. CAS PubMed Google
Scholar * Cambridge simulation glasses user's manual. Available at http://www-edc.eng.cam.ac.uk/idt-cn/csg/usermanualv3.pdf. Accessed 3 November 2014. * Ferris FL, Kassoff A, Bresnick
GH, Bailey I . New visual acuity charts for clinical research. _Am J Ophthalmol_ 1982; 94: 91–96. Article Google Scholar * Hazel CA, Elliott DB . The dependency of logMAR visual acuity
measurement on chart design and scoring rule. _Optom Vis Sci_ 2002; 79: 788–792. Article Google Scholar * Bailey IL, Benjamin WJ (ed.). _Visual acuity_. WB Saunders Company: Philadelphia,
PA, USA, 1988. Google Scholar * Sloan LL . New charts for the measurement of visual acuity at far and near distances. _Am J Ophthalmol_ 1959; 48: 807–813. Article CAS Google Scholar *
British Standards Institute _BS 4274-1:2003. Visual acuity test types- Part 1: Test Charts for Clinical Determination of Distance Visual Acuity—Specification_. BSI: : London, UK, 2003. *
Owsley C, McGwin G Jr . Vision and driving. _Vis Res_ 2010; 50: 2348–2361. Article Google Scholar * Fraser ML, Meuleners LB, Ng JQ, Morlet N . Driver self-regulation and depressive
symptoms in cataract patients awaiting surgery: a cross-sectional study. _BMC Ophthalmol_ 2013; 13: 45. Article Google Scholar * Dadona L, Dadona R . Revision of visual impairment
definitions in the International Statistical Classification of Diseases. _BMC Med_ 2006; 4: 7. Article Google Scholar * Elliott DB, Hurst MA . Simple clinical techniques to evaluate visual
function in patients with early cataract. _Optom Vis Sci_ 1990; 67: 822–825. Article CAS Google Scholar * Elliott DB, Situ P . Visual acuity versus letter contrast sensitivity in early
cataract. _Vis Res_ 1998; 38: 2047–2052. Article CAS Google Scholar * Bradley A, Thomas T, Kalaher M, Hoerres M . Effects of spherical and astigmatic defocus on acuity and contrast
sensitivity: a comparison of three clinical charts. _Optom Vis Sci_ 1991; 68: 418–426. Article CAS Google Scholar * Gov.uk. Average age of candidates passing their car practical driving
test. Available at https://www.gov.uk/government/publications/average-age-of-candidates-passing-their-car-practical-driving-test. Accessed on 3 November 2014. * Regan D, Neima D .
Low-contrast letter charts in early diabetic retinopathy, ocular hypertension, glaucoma, and Parkinson's disease. _Br J Ophthalmol_ 1984; 68: 885–889. Article CAS Google Scholar *
Williamson TH, Strong NP, Sparrow J, Aggarwal RK, Harrad R . Contrast sensitivity and glare in cataract using the Pelli-Robson chart. _Br J Ophthalmol_ 1992; 76: 719–722. Article CAS
Google Scholar Download references ACKNOWLEDGEMENTS This research received no specific grant from any funding agency in the public, commercial or not-for-profit sector. The authors would
like to thank Agatha Jaworski and Jessica Massey for assistance with data collection. AUTHOR INFORMATION AUTHORS AND AFFILIATIONS * Department of Vision and Hearing Sciences, Visual Function
and Physiology Research Group, Anglia Ruskin University, Cambridge, UK S Rae, K Latham & M F Katsou * Vision and Eye Research Unit, Anglia Ruskin University, Cambridge, UK S Rae & K
Latham Authors * S Rae View author publications You can also search for this author inPubMed Google Scholar * K Latham View author publications You can also search for this author inPubMed
Google Scholar * M F Katsou View author publications You can also search for this author inPubMed Google Scholar CORRESPONDING AUTHOR Correspondence to S Rae. ETHICS DECLARATIONS COMPETING
INTERESTS The authors declare no conflict of interest. RIGHTS AND PERMISSIONS Reprints and permissions ABOUT THIS ARTICLE CITE THIS ARTICLE Rae, S., Latham, K. & Katsou, M. Meeting the
UK driving vision standards with reduced contrast sensitivity. _Eye_ 30, 89–94 (2016). https://doi.org/10.1038/eye.2015.188 Download citation * Received: 13 April 2015 * Accepted: 27 August
2015 * Published: 16 October 2015 * Issue Date: January 2016 * DOI: https://doi.org/10.1038/eye.2015.188 SHARE THIS ARTICLE Anyone you share the following link with will be able to read this
content: Get shareable link Sorry, a shareable link is not currently available for this article. Copy to clipboard Provided by the Springer Nature SharedIt content-sharing initiative

:max_bytes(150000):strip_icc():focal(216x0:218x2)/benedict-cumberbatch-1-435-4-20cc736017b24435a3498a49d7c22b0e.jpg)