- Select a language for the TTS:
- UK English Female
- UK English Male
- US English Female
- US English Male
- Australian Female
- Australian Male
- Language selected: (auto detect) - EN
Play all audios:
The analysis of age-specific genetic effects on human survival over extreme ages is confronted with a deceleration pattern in mortality that deviates from traditional survival models and
sparse genetic data available. As human late life is a distinct phase of life history, exploring the genetic effects on extreme age survival can be of special interest to evolutionary
biology and health science. We introduce a non-parametric survival analysis approach that combines population survival information with individual genotype data in assessing the genetic
effects in cohort-based longitudinal studies. Our approach is characterized by non-parametric analysis of late age survival to capture the observed pattern of mortality deceleration and
frailty modeling to account for individual heterogeneity in unobserved frailty. The method is applied to ApoE genotype data in the Danish 1905 birth cohort to estimate effect of the e4
allele. Our results revealed an age-specific relative risk of the allele that increases nonlinearly with age and non-proportional patterns in hazard of death for carriers and non-carriers of
the allele, suggesting that the e4 mutation preserves its deleterious effect that progressively affect human survival even at extreme ages.
The evolutionary theory of aging assumes that the effect of a gene could change over an individual’s life course as genetic mutation functioning at late ages are subject to weaker selection
than early-acting mutations.1 The age-specific genetic effects have been shown to affect fitness traits in animal models.2 In humans, age-specific effects of genetic variations have been
reported to influence body mass index,3 blood pressure4, 5 and survival.6 At late life, the force of natural selection during the reproductive period stops. In term of survival, mortality
deviates significantly from the popular Gompertz model with a reliable attribute characterized by deceleration in age-specific mortality rates.7 The paradoxical ‘plateaued’ mortality pattern
implies that late life is a distinct phase of life history8 for which exploring the genetic effects can be of special interest to evolutionary biology and health science.
The estimation of an age-dependent genetic effect on survival can often be confounded by differential life course exposure to environmental factors or the birth cohort effect in
age-structured populations.9 For that reason, a good choice is to conduct a follow-up or longitudinal study on a birth cohort, which has only been feasible in animal experiments. In human
studies, however, longitudinal analysis on genetic association with human longevity can be done with old-aged birth cohorts, for example, the Danish 1905 birth cohort,10 to look for genes
that affect extreme age survival.9, 11, 12 Although of great interest, estimating genetic effects on late life survival is confronted with the distinct mortality pattern and sparse genetic
data available. In the literature, different theories or models have been proposed to explain the late life-mortality pattern,8 among them the heterogeneity model,13 which assumes individual
heterogeneity in unobserved frailty that follows a gamma distribution. Jacobsen et al11 applied a Cox regression model with gamma-distributed frailty to the Danish 1905 birth cohort data to
estimate the age-dependent effect on extreme age survival for the ApoE gene, the only gene whose role on longevity has been consistently demonstrated.14 This paper introduces a demographic
heterogeneity model that combines sparse individual genotype data with population survival information to measure age-specific genetic effect on survival at advanced ages. The method is
applied to ApoE genotype data from the Danish 1905 birth cohort10 to illustrate the patterns of the age-specific effect of the e4 allele in affecting extreme age survival. Results with and
without consideration of unobserved frailty will be compared and genotype-specific mortality patterns illustrated.
For a given genetic variation, for example, a SNP, individuals can be grouped according to their genotypes for a certain allele as non-carriers (0 allele), heterozygous (1 allele) and
homozygous (2 alleles) carriers based on which effect of the allele can be assumed to be additive, dominant or recessive. For simplicity, we divide individuals as carriers and non-carriers
of the allele, which is equivalent to a dominant assumption. In term of survival, the population survival rate in a birth cohort is the weighted mean for allele carriers (≥1 allele) and
non-carriers (0 allele),15
Here, s̄(x) is the mean survival rate in the birth cohort at age x, p is frequency of carriers of the allele, s1(x) and so(x) are survival rates for carriers and non-carriers of the allele.
The relationship between s1(x) and s0(x) reflects relative risk of the allele on survival. In a simple proportional hazard model, the hazards of death corresponding to s1(x) and s0(x) are
related as μ1(x)=rμ0(x) such that
The relationship above is based on the assumption that individuals are homogenous except for their genotypes of the allele. However, in reality, individuals are heterogeneous in their
unobserved factors or frailty, including genetic make-ups, which serves as the basis for existing theories that explain mortality deceleration at advanced ages, among which is the
demographic heterogeneity theory by Vaupel et al.13 It follows that, when an individual’s unobserved frailty designated as z is gamma-distributed with mean 1 and variance σ2, instead of (2),
the relationship between s1(x) and s0(x) becomes
s′(x) is a homogenous baseline survival function. Note that the integration of (3) with (1) combines population survival with genotype frequency and relative risk parameters, which allows
assessment of genetic effect on survival.
Based on (1), the proportions of carriers and non-carriers of the allele at any age x can be estimated as and , respectively. When genotype data is available for a random sample from the
cohort, a likelihood function based on binomial distribution can be constructed at each age x as
In (4), n1(x) and n0(x) are the number of counts for carriers and non-carriers of the allele at age x, p is proportion of carriers in the population, which can be available for specific
populations and s̄(x is population survival rate at age x obtainable from population statistics. With known s̄(x and p, (4) can be maximized to estimate the relative risk on survival for
carrying the allele. In a longitudinal study on a birth cohort, (4) can be done for each age or year of follow-up so that age-specific effects can be estimated. The maximum likelihood
estimation (MLE) is obtained by introducing a constraint as specified in (1) and optimization of (4) with numerical gradient and Hessian. Note that our MLE is free from specification of any
parametric form for the survival function and is thus a non-parametric approach. In addition, it combines or makes use of population data in the analysis of genetic effect. Moreover,
genotype-specific survival or mortality rates can be calculated at each age to further illustrate the genetic influence on mortality at advanced ages.
Finally, our model allows analysis of sex-specific effect16 by simply replacing the mean cohort survival in (1) with survival rate for males or females and performing the analysis for each
sex separately. However, because most of the survivors at extreme ages are females, insignificant results in males due to small sample sizes available may not necessarily mean sex-specific
effect. In this case, a combined analysis should be preferred.
We applied our method to the ApoE genotype data collected on 2662 individuals (584 males and 2078 females) from the Danish 1905 birth cohort10 collected in a longitudinal survey initiated in
1998. All participants were genotyped at age 92–93 years. Individual survival information has been collected with the latest update at the end of 2010 when 10 subjects were still alive with
their ages over 104 or 105. For the entire 1905 birth cohort, cohort-specific survival information is available from the Human Mortality Database at http://www.mortality.org/ jointly hosted
by University of California, Berkeley, and the Max Planck Institute for Demographic Research, Rostock, Germany. For the ApoE gene, frequency for the allele of interest, that is, the e4
allele, was estimated to be 0.174 in the Danish population,17 which corresponds to a carrier frequency of 0.318. As a ‘thrifty’ allele,18 carriers of e4 have been shown to have a higher
susceptibility to cardiovascular and Alzheimer’s diseases, and are associated with higher mortality as compared with non-carriers under the contemporary environmental condition.17, 19 As
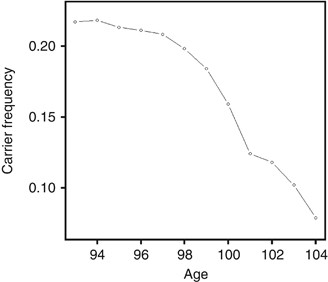
such, frequency of the allele is expected to decrease with increasing age in a birth cohort. In our genotype data for the 1905 birth cohort, it is interesting to see that the deceasing
pattern continues even at extreme ages starting with 21.7% at age 93 until 7.8% at age 104, a rapid decrease of about 14% in 11 years (Figure 1). The declining nonlinear pattern in e4 allele
frequency that accelerates with age gives a clear indication of a deleterious effect of the allele on human extreme age survival, which needs to be characterized or measured by proper
statistical models.
Frequency of e4 allele carriers in the 2662 subject from the 1905 birth cohort starting from age 93 until age 104. There is a clear pattern of rapid decline as age increases, suggesting the
increased risk of the allele on survival over advanced ages.
With known population survival for the entire 1905 birth cohort and frequency of e4 allele in the Danish population, we first fitted the likelihood function in (4) without frailty using
genotype-specific survival as defined in (2). For each age x, our procedure estimated an age-specific relative risk on surviving from age x to x+1 (Table 1). Our results showed that the
estimated risks were all significantly different from one over all ages with a slight trend of increase at later ages. Figure 2a plots the estimated age-specific relative risks together with
their 95% confidence intervals. The figure clearly displays the increasing risk for the e4 allele in the oldest survivors. The highest risk of 1.23 (P=0.026) was obtained at the highest age
of 104. We continued our analysis with frailty modeling by introducing gamma-distributed frailty with mean of 1 and variance of 0.1 (according to our experience in fitting frailty models to
oldest-old mortality). From the estimated relative risks (Table 1), one could see that the frailty model gives higher risk estimates as compared with the no frailty model. In addition to
the increased risk, the age-dependent increase in risk estimates is more clearly seen with frailty modeling, although the overall pattern of increase remained (Figure 2b).
Estimated age-specific relative risks for carrying the e4 allele over extreme age survival with 95% confidence intervals, which deviate from constant and increase slightly over ages. Risk
estimates without (a) and with (b) consideration of unobserved heterogeneity show obvious underestimation by the former, suggesting the necessity of frailty modeling.
Using the relationships in (2) and (3), age-specific survivals for carriers and non-carriers of the e4 allele can be calculated with the estimated relative risk and baseline survival rate.
This allows calculation of age-specific hazard rate μ(x) because μ(x)=−d(ln s(x))/dx . In Figure 3, we show the non-parametric age-specific hazard functions for the total population starting
from age 80 (solid line) and the e4 allele carriers (dashed line) and non-carriers (dash-dotted line) starting from age 93. Although mortality patterns for carriers and non-carriers
followed the main pattern of the whole cohort, carriers had higher whereas non-carriers had lower instant probability of death than that for the mean population, and overall this deviation
grew larger at later ages. Moreover, the population mortality pattern in Figure 3 also exhibits the mortality leveling-off at high ages, suggesting the necessity of frailty modeling.
Age-specific hazards of death for the whole 1905 birth cohort starting from age 80 (solid line) and e4 allele carriers (dashed line) and non-carriers (dash-dotted line) starting from age 93.
The genotype-specific mortality deviates remarkably from proportional.
Note that the calculated patterns of genotype-specific hazards were the same for both frailty and no frailty models as optimization of (4) was done for each age, however, the genetic risk
was underestimated when unobserved heterogeneity in frailty is ignored.
Finally, we applied the frailty model to another example for SNP rs2764264 in the FOXO3A gene. The SNP was first reported to show association with human longevity in a case–control study
conducted in the Italian population.20 Recently, the SNP was tested in both case–control samples and the Danish 1905 cohort with the significant association replicated only in the
case–control samples.21 In Figure 4, we show age-specific risks estimated from our frailty modeling (frequency of carriers of minor allele set to 0.495 according to Soerensen et al21).
Different from the e4 all of ApoE gene, no risk estimate in Figure 4 reached statistical significance, although there is a slight trend toward a protective effect similar to that reported in
the literature in case–control studies.20, 21
Age-specific relative risks for carrying minor allele of SNP rs2764264 in the FOXO3A gene estimated with consideration of unobserved heterogeneity. No risk estimate reached statistical
significance, although there is a slight trend of protective effect.
The cohort study is deemed as the most ideal design for assessing risk factors that affect human longevity9 and in characterizing their age-specific effects. In humans, longitudinal
following up for survival analysis is only feasible in very old cohorts, such as the Danish 1905 birth cohort. However, at advanced ages, human survival is characterized by mortality
deceleration, which challenges conventional survival models.8 We introduced a non-parametric survival analysis that combines population survival information with individual genotype data in
estimating the genetic effects on human longevity. Our method conducts frailty modeling by introducing the simple gamma frailty model. Our comparison with a model that ignores unobserved
heterogeneity showed underestimated genetic effect by the latter, which emphasizes the importance of frailty modeling in genetic risk assessment at advanced ages. The constraint likelihood
for parameter estimation integrates population data with individual genotype data and allows non-parametric estimation of genetic risk parameters and the baseline survival function to avoid
specification of parametric survival models that deviate from the observed mortality pattern. In addition to parameter estimation, our procedure also calculates non-parametric
genotype-specific hazard of death over the observed ages to allow comparison with population mean death rate (Figure 3).
Our likelihood-based procedure is made possible by restricting estimation on each age separately. As an advantage, this allows measurement of age-specific genetic effect. As shown by Figure
2, the age-specific pattern of the estimated genetic risk deviates clearly from being constant or linear, which contradicts to the proportional hazard assumption. From the hazard functions
for carriers and non-carriers of e4 allele, one can easily see that they are far from proportional. Such a pattern will be missed by traditional survival analysis, such as the Cox’s
proportional hazard model. In Table 2, we compare the different analyses that have been applied to the ApoE genotype data in the 1905 cohort. The early analysis (with high censoring rate of
17%) by Bathum et al22 (Table 2) obtained an overall risk for e4 carriers, which was only borderline significant. Jacobsen et al11 introduced Aalen’s additive hazards model,23 an extended
Cox model, to estimate age-dependent risk assuming additive risks over age intervals. It is interesting that, when applied to the same updated data set (censoring rate 4%), their analysis
also reported the increased effect of the e4 allele on longevity, although their analysis was limited to three age intervals. In comparison, our combined analysis of population and
individual data enabled estimation for each age until the age as high as 104 years such that patterns of the mean genetic effects and genotype-specific mortality at extreme ages can be
examined (Table 2). It can be expected that, with the rapid development in the SNP genotyping and genome sequencing, more genetic data will be available for association analysis of human
extreme age survival for which proper statistical models can contribute.
This work was partially supported by the EU Seventh Framework Programme (FP7/2007–2011) under grant agreement no 259679 and NIH/NIA grant P01 AG08761.
Epidemiology, Institute of Public Health, University of Southern Denmark, Odense C, Denmark
Qihua Tan, Rune Jacobsen, Mette Sørensen, Lene Christiansen & Kaare Christensen
Department of Clinical Genetics, Odense University Hospital, Odense C, Denmark
Qihua Tan, Lene Christiansen, Torben A Kruse & Kaare Christensen
Department of Biochemistry and Pharmacology, Odense University Hospital, Odense C, Denmark
Anyone you share the following link with will be able to read this content: