- Select a language for the TTS:
- UK English Female
- UK English Male
- US English Female
- US English Male
- Australian Female
- Australian Male
- Language selected: (auto detect) - EN
Play all audios:
ABSTRACT Cottonwoods are foundation riparian species, and hybridization among species is known to produce ecological effects at levels higher than the population, including effects on
dependent species, communities and ecosystems. Because these patterns result from increased genetic variation in key cottonwood traits, novel applications of genetic tools (for example, QTL
mapping) could be used to place broad-scale ecological research into a genomic perspective. In addition, linkage maps have been produced for numerous species within the genus, and, coupled
with the recent publication of the _Populus_ genome sequence, these maps present a unique opportunity for genome comparisons in a model system. Here, we conducted linkage analyses in order
to (1) create a platform for QTL and candidate gene studies of ecologically important traits, (2) create a framework for chromosomal-scale perspectives of introgression in a natural
population, and (3) enhance genome-wide comparisons using two previously unmapped species. We produced 246 backcross mapping (BC1) progeny by crossing a naturally occurring F1 hybrid
(_Populus fremontii_ × _P. angustifolia_) to a pure _P. angustifolia_ from the same population. Linkage analysis resulted in a dense linkage map of 541 AFLP and 111 SSR markers distributed
across 19 linkage groups. These results compared favorably with other _Populus_ linkage studies, and addition of SSR loci from the poplar genome project provided coarse alignment with the
genome sequence. Preliminary applications of the data suggest that our map represents a useful framework for applying genomic research to ecological questions in a well-studied system, and
has enhanced genome-wide comparisons in a model tree. SIMILAR CONTENT BEING VIEWED BY OTHERS GENOMIC VARIATION OF EUROPEAN BEECH REVEALS SIGNALS OF LOCAL ADAPTATION DESPITE HIGH LEVELS OF
PHENOTYPIC PLASTICITY Article Open access 03 October 2024 GENETIC DIVERSITY AND STRUCTURE IN WILD ROBUSTA COFFEE (_COFFEA CANEPHORA_ A. FROEHNER) POPULATIONS IN YANGAMBI (DR CONGO) AND THEIR
RELATION TO FOREST DISTURBANCE Article 03 January 2023 UNLOCKING SPANISH PEAR GENETIC DIVERSITY: STRATEGIES FOR CONSTRUCTION OF A NATIONAL CORE COLLECTION Article Open access 04 November
2024 INTRODUCTION Over the past decade, advances in DNA marker technology have provided a glimpse into the genetic bases of ecological processes, expanding our knowledge of ecological
genetics (reviewed in Via, 2002) and leading to the emerging field of community and ecosystem genomics (see Feder and Mitchell-Olds, 2003; Thomas and Klaper, 2004; Mauricio, 2005; Whitham et
al., 2006). The ability to identify and characterize quantitative trait loci (QTL) associated with traits of ecological significance continues to be an important task and has contributed
significantly to an understanding of ecological processes from a genomic perspective (Jackson et al., 2002). Marker techniques such as amplified fragment length polymorphisms (AFLP, Vos et
al., 1995) have made linkage and QTL mapping possible for virtually any organism by overcoming the major barrier to such studies in the past (that is, lack of sufficient markers, see review
by Doerge (2002)). In addition to AFLP based maps, over 4000 SSR markers have been developed for the genus _Populus_ (http://www.ornl.gov/sci/ipgc/ssr_resource.htm), many of which have been
used for genetic mapping in both _Populus_ (discussed below) and the related genus _Salix_ (Hanley et al., 2006, see also the above website). These markers provide a unique opportunity for
wide-ranging comparative genomic studies across diverse taxa. Beginning with Keim et al. (1989) and Whitham (1989), 18 years of research on a cottonwood hybrid zone (_Populus fremontii_ ×
_P. angustifolia_) in northern Utah has revealed numerous relationships between genetic variation (via hybridization) in a foundation tree and higher order processes. Genetically based
variation in cottonwood phytochemical (for example, Driebe and Whitham, 2000; Schweitzer et al., 2004; Bailey et al., 2004, 2005; Rehill et al., 2006), morphological (for example, Floate and
Whitham, 1995; Larson and Whitham, 1997) and phenological traits (for example, Floate et al., 1993) has been shown to affect populations, communities and ecosystem processes at multiple
scales including individual trees, stands, rivers and the western US region (Bangert et al., 2006a, 2006b). These patterns suggest that novel applications of population and quantitative
genetic tools may provide unprecedented opportunities to link genetic factors (for example, QTL and genes) with ecological patterns. This would help fulfill a major goal of placing community
and ecosystem ecology within an evolutionary framework (Mitton, 2003; Whitham et al., 2003, 2006). In addition to its potential as a model organism for ecological research, _Populus_ has
recently emerged as a premier model for forest tree biology and improvement (Taylor, 2002; Wullschleger et al., 2002). Characteristics such as ease of vegetative and seed propagation, fast
growth rate, small genome size, and conservation of chromosome number across the genus (_n_=19) make _Populus_ ideal for experimental research, and mapping populations have been produced for
numerous geographically and ecologically distinct species from diverse sections within the genus (see Table 2 below). These experimental populations provide a unique opportunity for
comparative linkage mapping in a model system (for example, Yin et al., in review)—an opportunity that has been further enhanced by the recent publication of the _P. trichocarpa_ genome
sequence (Tuskan et al., 2006). Here, we have created a high-density AFLP linkage map from a segregating interspecific backcross population of hybrid cottonwoods (_P. fremontii_ × _P.
angustifolia_). We chose a backcross design for four reasons: first, because few codominant markers had been developed for _Populus_ at the beginning of our study, we used a dominant marker
system (AFLP) which is best served by a backcross design (that is, few repulsion phase markers); second, our study was aimed at identifying QTL of ecological importance in a hybrid system
where F2's (but not backcrosses) are apparently rare (Keim et al., 1989); third, introgression in the natural population occurs unidirectionally (_P. fremontii_ alleles to _P.
angustifolia_) (Keim et al., 1989; Martinsen et al., 2001); and fourth, F1 × F1 crosses in the greenhouse showed decreased success relative to backcrosses, suggesting negative interactions
in the F2 generation (G Martinsen, unpublished data). We aligned our map with Yin et al.'s (2004) map using SSR markers from the poplar genome sequence project (Tuskan et al., 2006) in
order to link our data with the poplar genome sequence. The specific objectives of this study were to (1) create a linkage map for future QTL and candidate gene studies of ecologically
important traits, (2) provide a framework for a chromosomal scale perspective of introgression in a natural system, and (3) to enhance comparisons of genome structure among multiple species
within the genus. MATERIALS AND METHODS MAPPING PEDIGREE AND DNA EXTRACTION Parents for a segregating backcross mapping population were chosen from a naturally occurring hybrid zone on the
Weber River in northern Utah. Parental species/hybrid class was determined using preliminary marker data from 33 nuclear RFLP loci (detailed in Martinsen et al., 2001). Using the technique
of Stanton and Villar (1996), we crossed a _P. angustifolia_ female clone (#996) with a male F1 hybrid (_P. fremontii_ × _P. angustifolia_, clone WSU-6) resulting in 246 full-sib backcross
progeny. The seed progeny were germinated under a misting bench within 2 weeks of dehiscence and planted in standard potting mix. Cuttings of the parental clones were made at the same time.
Cuttings from the parent clones and hybrid progeny were grown in a greenhouse for 2 years under uniform conditions. Fresh leaves were collected from parents and progeny at the height of the
growing season, frozen on dry ice, and in some cases lyophilized. DNA was extracted as per Martinsen et al. (2001), or using the Qiagen DNeasy plant miniprep kit (Qiagen, Helden, Germany).
Reanalysis of RFLP markers subsequent to the cross confirmed WSU-6 as an F1 hybrid, but showed _P. angustifolia_ clone #996 to likely be an advanced backcross hybrid/introgressant (see
Martinsen et al., 2001) heterozygous for _P. fremontii_ and _P. angustifolia_ alleles at a single locus (RFLP probe p1254, Bradshaw and Stettler, 1993). AFLP ANALYSIS AFLP analysis was
performed using the method of Vos et al. (1995) with modifications from Travis et al. (1996). Preselective amplification was conducted using adenine (A) as the first selective base in all
cases. Forty-five 3+3 primer combinations (_Eco_RI+AXX/_Mse_I+AXX) were chosen at random, and used to generate marker data. Marker names include the second and third selective bases for the
_Eco_RI enzyme followed by the second and third _Mse_I selective bases, and finally by the approximate marker size in base pairs. For example, GGCC150 represents a 150 bp marker generated
from an _Eco_RI+AGG/_Mse_I+ACC primer combination. SSR ANALYSIS A subset of 46 individuals from our mapping population were screened with 341 SSR markers that were derived from the _Populus
trichocarpa_ whole-genome sequencing project, and mapped in a _P. trichocarpa_ × _P. deltoides_ (TD) pedigree to enhance genome assembly (Tuskan et al., 2006). These SSR markers were
selected at regular intervals throughout the genome to allow integration of the _P. angustifolia_ × _P. fremontii_ map with the whole-genome sequence, and to enhance comparisons of genome
structure among multiple members of the genus. Initial screening was conducted with both parents and six progeny, and loci that appeared to be segregating in both parents were selected for
mapping. SSR amplification and genotyping was performed as described elsewhere (Yin et al., 2004), except loci were analyzed on an ABI3730 automated capillary electrophoresis instrument, and
amplification was performed with 10 pmol fluorescein 12-dUTP (Roche Diagnostics, Indianapolis, IN, USA), rather than end-labeled primers. MARKER SEGREGATION AND MAP CONSTRUCTION Linkage
analysis was restricted exclusively to markers with expected segregation ratios of 1:1 (that is, testcross markers where the F1 parent was +/− and the _P. angustifolia_ parent −/−, see
Supplementary Table S1, electronic Supplementary Material). Segregation distortion in the testcross markers was assessed using a _χ_2 analysis, and was identified as significant
(_P_<0.05) deviation from expected Mendelian segregation. Distorted markers were not excluded from the linkage analysis (discussed below). Species origins of markers were inferred
primarily on the assumption that markers that were homozygous null in _P. angustifolia_ and heterozygous in the F1 were likely fixed absent or rare in _P. angustifolia_ and present in _P.
fremontii_. Furthermore, markers that were putatively derived from the same species were consistently in the same linkage phase, and were generally fixed in wild populations (M Zinkgraf, S
Woolbright and G Allan, unpublished data), thus lending support to our assumptions. The linkage map was created using MAPMAKER 3.0 (Lander et al., 1987). Given the number of framework
markers from preliminary results (Woolbright, 2001), the estimated genome size from Bradshaw et al. (1994) and whole-genome sequence assembly (Tuskan et al., 2006), and simulations from Yin
et al. (2004), we chose an LOD score of 8.0 for linkage analysis. We then determined the appropriate recombination fraction (rf=0.37) using the relationship between LOD score and population
size described in Cervera et al. (2001) (see also Yin et al., 2004). Using these values as the ‘default linkage criteria’, preliminary linkage groups were identified with the ‘groups’
command. Marker data were then inverted for the entire dataset in order to place possible repulsion phase markers. Once initial groups were identified, one or two anchor loci were chosen to
begin map construction. Markers within each group were ordered using the ‘Order’ command, and initial orders checked using the ‘ripple’ command again with an LOD threshold of 8.0. Additional
markers were added using the ‘build’ command and checked with the ‘ripple’ command. When markers could not be ordered unambiguously, the marker with the least amount of missing data was
usually chosen as a framework marker and the rest added as accessory markers using the ‘try’ command. Occasionally, markers that resulted in the least number of likely scoring errors or in
the least amount of map expansion were chosen for the framework map. SSR were also placed in the framework AFLP map using the ‘try’ command. Because SSR markers were mapped using a much
smaller population size, distances between framework AFLP markers were fixed, and SSR positions were determined by interpolation between framework positions. Codominant SSR were used to
infer alignment with other Populus maps, and each linkage group was reoriented and assigned a name according to the convention of the International Populus Genome Consortium
(http://www.ornl.gov/sci/ipgc/) and Cervera et al. (2001). Once linkage groups were characterized, the size of blocks showing segregation distortion in favor of a particular allele was
estimated as per Yin et al. (2004). These values were then used to calculate the ratio of distorted regions to total length of the chromosome. MARKER DISTRIBUTION The distribution of markers
among linkage groups was calculated using the method from Remington et al. (1999). Using the Poisson distribution, we evaluated the probabilities _P_(_m_⩽_λ_) and _P_(_m_⩾_λ_) at _α_⩽0.05
where _m_ and _λ_ are the total and expected marker numbers, respectively, for each linkage group. We also looked for regions of clustering and dispersion within each linkage group using the
method from Yin et al. (2004). By sliding along each linkage group, ‘windows’ for clustering analysis were identified as consecutive intervals where marker spacing was less than the average
spacing for the entire map. Windows for testing marker dispersion were defined by consecutive intervals with spacing greater than the average. The number of markers within each window was
counted, and compared to the null expectation for evenly spaced markers for a particular window size. Significant departures from expectation were tested under a cumulative Poisson
distribution using a one-tailed test (_α_⩽0.05). GENOME LENGTH AND COVERAGE Observed genome length was calculated as the sum (cM) of all linkage groups for both the complete (all markers)
and framework maps. Only framework markers were used to estimate genome length in order to avoid problems associated with marker clustering (see Cervera et al., 2001). Estimated genome
length was calculated using the method from Hulbert et al. (1988), which provides an estimate based on partial linkage data. We also used the method from Nelson et al. (1994), which
incorporates information from all linked and unlinked markers. Observed map coverage was calculated as the ratio of observed map length to the estimated map length (Ge from Hulbert et al.,
1988) for both the complete and framework maps. Theoretical map coverages were estimated for the framework map as per Lange and Boenke (1982), which accounts for chromosomal ends; and using
the method from Bishop et al. (1983), which accounts for linear chromosomes. RESULTS MARKER ANALYSIS Forty-five AFLP primer combinations yielded a total of 809 scorable polymorphic markers,
with an average of 18 polymorphisms per primer combination. Of these, 564 were ‘pseudo-testcross’ markers with the F1 parent heterozygous (+/−), and the recurrent parent carrying only the
null allele (−/−). Of the remaining markers, 97 were ‘intercross’ markers (+−/+−), and 148 were heterozygous in the recurrent parent (−−/+−, see Supplementary Table S1, ESM). These were
excluded from linkage analysis. A total of 790 monomorphic fragments (average 17.6 per primer combination) were also identified. Of the 341 SSR markers tested, 89 failed to amplify, 35 were
monomorphic, 24 were intercross informative, 86 were paternally informative, 32 were maternally informative and 75 were both paternally and maternally informative. SEGREGATION DISTORTION
Chi-square analysis of the raw AFLP marker data revealed significant (_P_⩽0.05) deviation from the expected 1:1 segregation pattern in 113 of the 541 (21%) mapped AFLP testcross markers.
Table 1 summarizes genome-wide segregation distortion at the level of individual linkage groups. Fifteen distinct regions or blocks of distortion occurred on 11 of 20 linkage groups, with
two linkage groups (XVIII and XIX) exhibiting distortion across more than half their lengths. The size of the distorted regions varied among linkage groups. Distortion occurred more often in
the direction of the recurrent allele (_P. angustifolia_), with 276.1 cM distorted (13.4% of the genome) vs 112.6 cM for the donor allele (_P. fremontii_ 5.5% of the genome). MAP
CONSTRUCTION GENOME LENGTH, AND COVERAGE MAPMAKER grouped the 564 AFLP testcross markers into 19 linkage groups, one triplet and nine unlinked markers. Twenty-four markers were removed from
the analysis due to unnecessary map expansion or linkage to multiple groups. This was most often caused by the inclusion of faint markers that were difficult to score, and/or by extreme
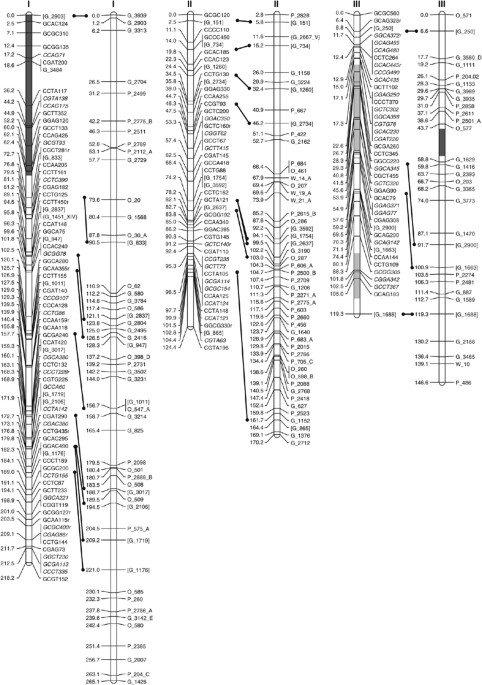
segregation distortion that may have been the result of comigration of separate loci. One hundred eleven SSR markers were placed in interpolated positions (see Materials and methods),
including a minimum of 2 and a maximum of 11 markers on each of the 19 _Populus_ linkage groups (Figure 1). A total of 328 framework AFLP markers were identified and used to create a
framework map spanning a distance of 2030.6 cM. Table 2 summarizes the results of our linkage and genome analyses, comparing them with results from other recent _Populus_ mapping efforts.
All results are within the range reported from other studies, except for Bishop et al.'s (1983) method for theoretical map coverage, which was slightly higher than the others. Table 3
summarizes AFLP marker distribution when all markers are considered. Three linkage groups (XIII, XV, and XIX) contained more markers than expected, and four (IX, XI, XII and XVIII) contained
less. At the level of individual linkage groups, significant clustering occurred within all but one (VII) major linkage group. DISCUSSION Our experimental design yielded a genetic map of
comparable quality to other _Populus_ maps (see Table 2). The number of major linkage groups was equal to that of the haploid chromosome number in _Populus_ (_n_=19). Our estimate of genome
length falls within the range observed from other studies and is near the original estimate of 2400–2800 cM set by Bradshaw et al. (1994), which has been verified through simulation studies
(Yin et al., 2004). Observed map length was also within the range of other _Populus_ maps but lower than our estimated length, and lower than the more robust map of Yin et al. (2004). The
discrepancy between estimated and observed lengths has been observed in other studies (Table 2), and can be explained by problems with marker clustering or dispersion due to map expansion
caused by cosegregation of AFLP bands and other genotyping errors. Marker clustering and dispersion were also comparable to other _Populus_ maps (for example, Yin et al., 2004). Explanations
for dispersion include regions of increased recombination and missing markers that have not been identified, perhaps due to gaps in occurrence of restriction enzyme recognition sites
(Supplementary Figure S1, ESM). The addition of multiallelic SSR markers has helped to alleviate these problems and the availability of a map-linked genome sequence (Tuskan et al., 2006)
will allow future targeted design of SSR and single nucleotide polymorphic (SNP) markers specifically for dispersed regions. Targeted SSR and SNP markers should also be useful for
characterizing problem areas arising from the presence of _P. fremontii_ alleles in the genome of the _P. angustifolia_ parent (for example, RFLP p1254, Martinsen et al., 2001). The presence
of introgressed (that is, intercross, Supplementary Table S1, ESM) fragments are indistinguishable from shared parental alleles and both likely lead to ‘blind spots’ when using dominant
markers to search for ecologically relevant QTL. If introgression is the result of positive selection, ecologically important regions of the genome could therefore be missed due to poor
linkage data when codominant markers are unavailable. Future addition of evenly distributed, targeted SSRs, combined with introgression studies in natural populations should help alleviate
this problem. In contrast to dispersed regions, we observed marker clusters for all but one (VII) of the 19 major linkage groups. Some marker clusters (that is, 5% at _α_=0.05) are expected
due to random chance. Clustering also occurs in regions of the genome with reduced recombination and has been used to describe structural features of chromosomes. Young et al. (1999) were
able to identify likely positions of centromeres in soybean linkage groups by comparing the distribution of a methylation sensitive (_Pst_I) vs an insensitive restriction enzyme (_Eco_R1).
In the analysis, _Pst_I markers were underrepresented in marker clusters thought to occur in cytosine methylated heterochromatic regions surrounding the centromere. Thus, enzyme choice in
AFLP analyses might be used to produce more uniformly distributed maps. Finally, clustering may arise from problems with meiotic pairing due to divergence of parental chromosomes,
particularly when using interspecific crosses between highly divergent species. MAP COMPARISONS Our map showed a high degree of marker colinearity with the map of Yin et al. (2004); however,
map alignment using SSR markers identified two putative inversions, and eight putative translocations (Figure 1). Given the divergent species used in the comparison, chromosomal
rearrangements are not necessarily unexpected. Alternatively, the inversions on linkage groups XV and XVIII could be the result of errors in map order due to the small sample size used in
the SSR analysis. Marker translocations could also be the result of multiple and divergent SSR priming sites arising from recent or ancient genome duplications (see Tuskan et al., 2006).
These issues are being addressed by enhancing the resolution of our SSR map, by performing comparative analyses with additional _Populus_ genetic maps (Yin _et al._, in review), and by
resequencing and reassembling problematic areas of the genome (GA Tuskan, personal communication). The absence of major chromosomal rearrangements in this and other comparative mapping (for
example, Cervera et al., 2001), coupled with the shared areas of segregation distortion and recombination repression (Yin _et al._, in review) suggest that genic interactions are mostly
responsible for species barriers between _P. fremontii_ and _P. angustifolia_. These barriers likely resulted in decreased success observed in experimental F1 × F1 crosses and backcrosses to
_P. fremontii_ (G Martinsen, unpublished data), as well as unidirectional introgression in the natural system (Keim et al., 1989; Martinsen et al., 2001). Similar patterns have been
observed in other species from sections Tacamahaca and Aigeiros (Floate, 2004), and likely indicate shared barriers at the section level. Molecular data have contributed to the
characterization of such barriers by revealing ‘hallmarks’ such as segregation distortion (discussed below) and recombination repression. Linkage analyses, QTL studies and candidate gene
surveys have been useful for identifying traits and genes underlying these phenomena (for example, Bradshaw and Stettler, 1994; Cervera et al., 2001; Yin et al., 2004). Our sample size
allowed for only coarse map alignment, and reliable statistical tests for shared segregation distortion were not feasible. However, we did notice large areas of shared distortion favoring
Tacamahaca alleles on at least two linkage groups (IV and XIX). One of these (XIX) was used in a recent study by Yin _et al._ (in review) that identified similarities in recombination
repression and segregation distortion across multiple families. These patterns have provided insight into potential species barriers (for example, R genes), and suggest the evolution of a
primitive _Populus_ sex chromosome (Yin _et al._, in review). Thus, the data revealing segregation distortion in _P. fremontii_ × _P. angustifolia_ hybrids have contributed to our
understanding of _Populus_ at levels exceeding our original intention (that is, section vs species). In contrast to genic interactions contributing to species barriers, genetic admixture may
also lead to the adaptive introgression of alleles, an important but largely understudied aspect of plant evolution (Grant, 1971; Martinsen et al., 2001; Whitney et al., 2006). Recently,
Lexer et al. (2007) used map-based SSR to avoid tightly linked markers when surveying for introgression and linkage disequilibrium in European hybrid zones of _P. alba_ and _P. tremula_.
Primers for the loci they used are known to amplify in multiple species across several sections within the genus (see also Rahman and Rajora, 2002 and citations therein). SSR markers
developed for _Populus_ have also been used for mapping in _Salix_ (Hanley et al., 2006). Thus, map-based genetic markers provide a unique (but untested) opportunity for comparative studies
of introgression across multiple taxonomic levels. Furthermore, these studies demonstrate how research questions aimed at specific populations or species can contribute to a larger focus
(that is, evolution in the Salicacae), arguing for the continued use of map-based markers across broad areas of inquiry. SEGREGATION DISTORTION Segregation distortion is common in mapping
studies of forest trees and has been documented in most if not all _Populus_ mapping efforts. While distortion can influence map construction (Zhang et al., 2002 and citations theirin) and
may affect QTL detection through spurious associations, exclusion of distorted markers is not necessarily warranted as they may be linked to genes or traits of interest. For example, both
Cervera et al. (2001) and Yin et al. (2004) found that segregation distortion in some markers may have resulted from susceptibility to _Melamspora_ rust or other selective forces acting
during generation of the hybrid pedigree. Bradshaw and Stettler (1994) found that a recessive pollen lethal allele tightly linked to a mapped RFLP marker (p1054) in a _P. trichocarpa_ × _P.
deltoides_ cross was the most likely cause of distortion in their mapping population. These results suggest markers showing segregation distortion due to linkage with genes under selection
may have important ecological consequences, and should therefore be included in mapping studies of natural populations. Caution should be exercised however, when making conclusions involving
QTL linked to distorted markers. Assigning species status to dominant marker alleles is problematic given the difficulty distinguishing introgression from coancestry. Assuming most alleles
segregate in both species, we would have expected to see a more-or-less equal distribution of coupling- vs repulsion phase (that is, inverted markers). In our study, most mapped markers
(_n_=495 or 92%) were in coupling phase, and were likely donated by _P. fremontii_ chromosomes carried by the F1. Furthermore, in a survey of individuals from multiple populations of each
species, 71 of 100 mapped markers (71%) were fixed absent or rare (allele frequencies ⩽0.05) in _P. angustifolia_ relative to _P. fremontii_ (M Zinkgraf, S Woolbright and G Allan unpublished
data). Similarly, Martinsen et al. (2001) found that _P. fremontii-_specific alleles at 26 of 33 RFLP markers (78.8%) were absent from the _P. angustifolia_ zone. Given these data, the
difference in marker phase likely reflects a high level of divergence among the species, and AFLP alleles segregating in both species could indicate introgression. CONCLUSIONS AND FUTURE
RESEARCH Given the extensive amount of ecological research on the Weber River hybrid zone (Whitham et al., 2003, 2006), our map represents a unique opportunity to combine long-term
ecological research with map-based genetic techniques. For example, we have begun to identify QTL associated with a number of ecologically important traits such as condensed tannins, which
have important community and ecosystem phenotypes (Woolbright, 2001; Whitham et al., 2003). Foliar condensed tannin concentrations have been linked to arthropod communities (Whitham et al.,
2006), aquatic and terrestrial litter decomposition (Schweitzer et al., 2005; LeRoy et al., 2006), root production (Fischer et al., 2006) and nutrient cycling (Schweitzer et al., 2004).
Using the recently completed _Populus_ genome sequence (Tuskan et al., 2006), we have begun to build candidate gene lists for a number of ecologically relevant QTL. The ability to link
genetic-level factors with community composition and ecosystem-level processes is unprecedented, and demonstrates the potential of genetic mapping in ecological genetic/genomic research. The
original aim of our study was to describe broad-scale ecological processes in terms of the genetic variation within a foundation species. Historically, _P. fremontii_ and _P. angustifolia_
have played little if any commercial role, and have been studied primarily for their ecological importance. Here, we have shown that research focusing on specific ecological questions in two
largely overlooked species contributes to much larger questions relating to evolution in a model system, and studies such as those by Rahman and Rajora (2002); Hanley et al. (2006)and Lexer
et al. (2007) demonstrate the potential for comparative studies across even broader taxonomic levels. In light of these results, future genetic studies of _Populus_ and its relatives should
capitalize on the availability of shared SSR and other markers. REFERENCES * Bailey JK, Deckert R, Schweitzer JA, Rehill BJ, Lindroth RL, Gehring C _et al_. (2005). Host plant genetics
affect hidden ecological players: links among _Populus_, condensed tannins, and fungal endophyte infection. _Can J Bot_ 83: 356–361. Article Google Scholar * Bailey JK, Schweitzer JA,
Rehill BJ, Lindroth RL, Martinsen GD, Whitham TG (2004). Beavers as molecular geneticists: a genetic basis to the foraging of an ecosystem engineer. _Ecology_ 85: 603–608. Article Google
Scholar * Bangert RK, Lonsdorf EV, Wimp GM, Shuster SM, Fischer D, Schweitzer JA _et al_. (2006a). Genetic structure of a foundation species: scaling community phenotypes from the
individual to the region. _Heredity_ (advance online publication, 18 October 2006; doi:10.1038/sj.hdy.6800914). Article Google Scholar * Bangert RK, Turek RJ, Rehill B, Wimp GM, Meneses N,
Martinsen GD _et al_. (2006b). From genes to geography: a genetic similarity rule for arthropod community structure at multiple geographic scales. _Mol Ecol_ 15: 4215–4228. Article CAS
Google Scholar * Bishop DT, Cannings C, Skolnick M, Williamson JA (1983). The number of polymorphic DNA clones required to map the human genome. In: BS Weir (ed). _Statistical Analysis of
DNA Sequence Data_. Dekker: New York. pp 181–200. Google Scholar * Bradshaw Jr HD, Stettler RF (1993). Molecular genetics of growth and development in _Populus_ I. Triploidy in hybrid
poplars. _Theor Appl Genet_ 86: 301–307. Article Google Scholar * Bradshaw Jr HD, Stettler RF (1994). Molecular genetics of growth and development in _Populus_ II. Segregation distortion
due to genetic load. _Theor Appl Genet_ 89: 551–558. Article CAS Google Scholar * Bradshaw Jr HD, Villar M, Watson BD, Otto KG, Stewart S, Stettler RF (1994). Molecular genetics of growth
and development in _Populus._ III. A genetic linkage map of a hybrid poplar composed of RFLP, STS, and RAPD markers. _Theor Appl Genet_ 89: 167–178. Article CAS Google Scholar * Cervera
M, Storme V, Ivens B, Gusmao J, Liu BH, Hostyn V _et al_. (2001). Dense genetic linkage maps of three Populus species (Populus deltoides, P. nigra and P. trichocarpa) based on AFLP and
microsatellite markers. _Genetics_ 158: 787–809. CAS PubMed PubMed Central Google Scholar * Doerge RW (2002). Multifactorial genetics: mapping and analysis of quantitative trait loci in
experimental populations. _Nature Rev Genet_ 3: 43–52. Article CAS Google Scholar * Driebe EM, Whitham TG (2000). Cottonwood hybridization affects tannin and nitrogen content of leaf
litter and alters decomposition. _Oecologia_ 123: 99–107. Article CAS Google Scholar * Feder ME, Mitchell-Olds T (2003). Evolutionary and ecological functional genomics. _Nature Rev
Genet_ 4: 649–655. Article Google Scholar * Fischer DG, Hart SC, Rehill BJ, Lindroth RL, Keim P, Whitham TG (2006). Do high-tannin leaves require more roots? _Oecologia_ 149: 668–675.
Article CAS Google Scholar * Floate KD (2004). Extent and patterns of hybridization among the three species of _Populus_ that constitute the riparian forest of southern Alberta Canada.
_Can J Bot_ 82: 253–264. Article Google Scholar * Floate KD, Kearsley MJC, Whitham TG (1993). Elevated herbivory in plant hybrid zones: _Chrysomela confluens_, _Populus_ and phenological
sinks. _Ecology_ 7: 2056–2065. Article Google Scholar * Floate KD, Whitham TG (1995). Insects as traits in plant systematics: their use in discriminating between hybrid cottonwoods. _Can J
Bot_ 73: 1–13. Article Google Scholar * Frewen BE, Chen THH, Howe GT, Davis J, Rhode A, Boerjan W _et al_. (2000). Quantitative trait loci and candidate gene mapping of bud set and bud
flush in _Populus_. _Genetics_ 154: 837–845. CAS PubMed PubMed Central Google Scholar * Grant V (1971). _Plant Speciation_. Columbia University Press: New York. Google Scholar * Hanley
SJ, Mallot MD, Karp A (2006). Alignment of a _Salix_ linkage map to the _Populus_ genomic sequence reveals macrosynteny between willow and poplar genomes. _Tree Genet Genomes_ 3: 35–48.
Article Google Scholar * Hulbert SH, Ilott TW, Legg EJ, Lincoln SE, Lander ES, Michelmore RW (1988). Genetic analysis of the fungus, _Bremia lactucae_, using restriction fragment length
polymorphisms. _Genetics_ 120: 947–958. CAS PubMed PubMed Central Google Scholar * Jackson RB, Linder CR, Lynch M, Purugganan M, Somerville S, Thayer SS (2002). Linking molecular insight
and ecological research. _Trends Ecol Evol_ 17: 409–414. Article Google Scholar * Keim P, Paige KN, Whitham TG, Lark KG (1989). Genetic analysis of an interspecific hybrid swarm of
_Populus_: occurrence of unidirectional introgression. _Genetics_ 123: 557–565. CAS PubMed PubMed Central Google Scholar * Lander ES, Green P, Abrahamson J, Barlow A, Daly MJ, Lincoln S
_et al_. (1987). Mapmaker: an interactive computer package for constructing primary genetic linkage maps of experimental and natural populations. _Genomics_ 1: 174–181. Article CAS Google
Scholar * Lange K, Boenke M (1982). How many polymorphic genes will it take to span the human genome? _Am J Hum Genet_ 34: 842–845. CAS PubMed PubMed Central Google Scholar * Larson KC,
Whitham TG (1997). Competition between gall aphids and natural plant sinks: plant architecture affects resistance to galling. _Oecologia_ 109: 575–582. Article CAS Google Scholar * LeRoy
CJ, Whitham TG, Keim P, Marks JC (2006). Plant genes link forests and streams. _Ecology_ 87: 255–261. Article Google Scholar * Lexer C, Buerkle CA, Joseph JA, Heinze B, Fay MF (2007).
Admixture in European _Populus_ hybrid zones makes feasible the mapping of loci that contribute to reproductive isolation and trait differences. _Heredity_ 98: 74–84. Article CAS Google
Scholar * Martinsen GD, Whitham TG, Turek RJ, Keim P (2001). Hybrid populations selectively filter gene introgression between species. _Evolution_ 55: 1325–1335. Article CAS Google
Scholar * Mauricio R (2005). Can ecology help genomics: the genome as ecosystem? _Genetica_ 123: 1–2. Article Google Scholar * Mitton JB (2003). The union of ecology and evolution:
extended phenotypes and community genetics. _BioScience_ 53: 208–209. Article Google Scholar * Nelson CD, Kubisiak TL, Stine M, Nance WL (1994). A genetic linkage map of longleaf pine
(_Pinus palustris_ Mill) based on random amplified polymorphic DNAs. _J Hered_ 85: 433–439. Article CAS Google Scholar * Rahman MH, Rajora OP (2002). Microsatellite DNA fingerprinting,
differentiation, and genetic relationships of clones, cultivars, and varieties of six poplar species from three sections of the genus _Populus_. _Genome_ 45: 1083–1094. Article CAS Google
Scholar * Rehill B, Whitham TG, Martinsen GD, Schweitzer JA, Bailey JK, Lindroth RL (2006). Developmental trajectories in cottonwood phytochemistry. _J Chem Ecol_ 32: 2269–2285. Article
CAS Google Scholar * Remington DL, Whetten RW, Liu B-H, O'Malley DM (1999). Construction of an AFLP genetic map with nearly complete genome coverage in _Pinus taeda_. _Theor Appl
Genet_ 98: 1279–1292. Article CAS Google Scholar * Schweitzer JA, Bailey JK, Hart SC, Wimp GM, Chapman SK, Whitham TG (2005). The interaction of plant genotype and herbivory decelerate
leaf litter decomposition and alter nutrient dynamics. _Oikos_ 110: 133–145. Article CAS Google Scholar * Schweitzer JA, Bailey JK, Rehill BJ, Martinsen GD, Hart SC, Lindroth RL _et al_.
(2004). Genetically based trait in a dominant tree affects ecosystem processes. _Ecol Lett_ 7: 127–134. Article Google Scholar * Stanton BJ, Villar M (1996). Controlled reproduction of
_Populus_. In: Stettler RF, Bradshaw JDH, Heilman PE, and Hinkley TM (eds). _Biology of Populus and its Implications for Management and Conservation_. NRC Research Press: Ottawa. pp 113–138.
Google Scholar * Taylor G (2002). _Populus_: Arabidopsis for forestry. Do we need a model tree? _Ann Bot_ 90: 681–689. Article CAS Google Scholar * Thomas MA, Klaper R (2004). Genomics
for the ecological toolbox. _Trends Ecol Evol_ 19: 439–445. Article Google Scholar * Travis SE, Maschinkski J, Keim P (1996). An analysis of genetic variation in _Astragalus cremnophylax
var. cremnophylax,_ a critically endangered plant, using AFLP markers. _Mol Ecol_ 5: 735–745. Article CAS Google Scholar * Tuskan GA, DiFazio SP, Jansson S, Bohlmann J, Grigoriev I,
Hellsten U _et al_. (2006). The genome of black cottonwood, _Populus trichocarpa_ (Torr. & Gray). _Science_ 313: 1596–1604. Article CAS Google Scholar * Via S (2002). The ecological
genetics of speciation. _Am Nat_ 159: S1–S7. Article Google Scholar * Voorrips RE (2002). MapChart: software for the graphical presentation of linkage maps and QTLs. _J Hered_ 93: 77–78.
Article CAS Google Scholar * Vos P, Hogers R, Bleeker M, Reijans M, Van De Lee T, Hornes M _et al_. (1995). AFLP: A new technique for DNA fingerprinting. _Nucleic Acids Res_ 23:
4407–4414. Article CAS Google Scholar * Whitham TG (1989). Plant hybrid zones as sinks for pests. _Science_ 244: 1490–1493. Article Google Scholar * Whitham TG, Bailey JK, Schweitzer
JA, Shuster SM, Bangert RK, LeRoy CJ (2006). A framework for community and ecosystem genetics: from genes to ecosystems. _Nat Rev Genet_ 7: 510. Article CAS Google Scholar * Whitham TG,
Young WP, Martinsen GD, Gehring CA, Schweitzer JA, Shuster SM _et al_. (2003). Community and ecosystem genetics: a consequence of the extended phenotype. _Ecology_ 84: 559–573. Article
Google Scholar * Whitney KD, Randell RA, Rieseberg LH (2006). Adaptive introgression of herbivore resistance traits in the weedy sunflower _Helianthus annuus_. _Am Nat_ 167: 794–807.
Article Google Scholar * Woolbright SA (2001). Genetic analyses of a synthetic population of hybrid cottonwoods with implications for community-level processes. MSc Thesis, Northern
Arizona University, AZ. * Wu RL, Han YF, Hu JJ, Fang JJ, Li L, Li ML _et al_. (2000). An integrated map of _Populus deltoides_ based on amplified fragment length polymorphisms. _Theor Appl
Genet_ 100: 1249–1256. Article CAS Google Scholar * Wullschleger SD, Jansson S, Taylor G (2002). Genomics and forest biology: _Populus_ emerges as the perennial favorite. _Plant Cell_ 14:
2651–2655. Article CAS Google Scholar * Yin T, Zhang X, Huang M, Wang M, Zhuge Q, Tu S _et al_. (2002). Molecular linkage maps of the _Populus_ genome. _Genome_ 45: 541–555. Article CAS
Google Scholar * Yin TM, DiFazio SP, Gunter LE, Riemenschneider D, Tuskan GA (2004). Large-scale heterospecific segregation distortion in _Populus_ revealed by a dense genetic map. _Theor
Appl Genet_ 109: 451–463. Article CAS Google Scholar * Yin T-M, DiFazio SP, Gunter LE, Zhang X, Sewell MM, Woolbright SA _et al_. (in review). Genome structure and chromosomal
diversification revealed by comparative mapping in _Populus_. _Genome Res_ (submitted). * Young WP, Schupp JM, Keim P (1999). DNA methylation and AFLP marker distribution in the soybean
genome. _Theor Appl Genet_ 99: 785–790. Article CAS Google Scholar * Zhang DQ, Zhang ZY, Yang K, Tian L (2002). Segregation of AFLP markers in a (_Populus tomentosa_ × _P. bolleana_) ×
_P. Tomentosa_ Carr. BC1 family. _For Stud China_ 4: 21–26. Google Scholar Download references ACKNOWLEDGEMENTS We thank the National Science Foundation FIBR (DEB-0425908) and IRCEB
(DEB-0078280) grants and the Phoenix chapter of the Achievement Rewards for College Scientists (ARCS) Foundation for financial support, and the Ogden Nature Center, Utah Department of
Natural Resources, and the Bureau of Reclamation for common garden facilities. We also thank Jen Schweitzer, Joe Bailey, and Adrian Stone for their critical reviews; Bill Young, Mark Miller,
Joe Busch, and Jim Schupp for their assistance in the laboratory; Matt Zinkgraf and Gancho Slavov for sharing data; Stephanie Woolbright for assisting in the laboratory and greenhouse; and
the assistance of Brad Blake and the NAU research greenhouse staff. AUTHOR INFORMATION Author notes * G D Martinsen Present address: 6Current Address: EcoPlan Associates Inc., 701 W.
Southern Avenue Suite 203, Mesa, AZ 85210, USA., AUTHORS AND AFFILIATIONS * Department of Biological Sciences, Environmental Genetics and Genomics (EnGGen) Facility, Northern Arizona
University, Flagstaff, AZ, USA S A Woolbright, G D Martinsen, G J Allan, T G Whitham & P Keim * Merriam-Powell Center for Environmental Research, Northern Arizona University, Flagstaff,
AZ, USA S A Woolbright, G D Martinsen, G J Allan, T G Whitham & P Keim * Department of Biology, West Virginia University, Morgantown, WV, USA S P DiFazio * Oak Ridge National Laboratory,
Oak Ridge, TN, USA T Yin * Department of Plant Sciences, University of Tennessee, Knoxville, TN, USA X Zhang Authors * S A Woolbright View author publications You can also search for this
author inPubMed Google Scholar * S P DiFazio View author publications You can also search for this author inPubMed Google Scholar * T Yin View author publications You can also search for
this author inPubMed Google Scholar * G D Martinsen View author publications You can also search for this author inPubMed Google Scholar * X Zhang View author publications You can also
search for this author inPubMed Google Scholar * G J Allan View author publications You can also search for this author inPubMed Google Scholar * T G Whitham View author publications You can
also search for this author inPubMed Google Scholar * P Keim View author publications You can also search for this author inPubMed Google Scholar CORRESPONDING AUTHOR Correspondence to S A
Woolbright. ADDITIONAL INFORMATION Supplementary Information accompanies the paper on Heredity website (http://www.nature.com/hdy) SUPPLEMENTARY INFORMATION SUPPLEMENTARY TABLE S1 (XLS 17
KB) SUPPLEMENTARY FIGURE S1 (JPG 481 KB) RIGHTS AND PERMISSIONS Reprints and permissions ABOUT THIS ARTICLE CITE THIS ARTICLE Woolbright, S., DiFazio, S., Yin, T. _et al._ A dense linkage
map of hybrid cottonwood (_Populus fremontii_ × _P. angustifolia_) contributes to long-term ecological research and comparison mapping in a model forest tree. _Heredity_ 100, 59–70 (2008).
https://doi.org/10.1038/sj.hdy.6801063 Download citation * Received: 09 March 2007 * Revised: 17 August 2007 * Accepted: 18 August 2007 * Published: 26 September 2007 * Issue Date: January
2008 * DOI: https://doi.org/10.1038/sj.hdy.6801063 SHARE THIS ARTICLE Anyone you share the following link with will be able to read this content: Get shareable link Sorry, a shareable link
is not currently available for this article. Copy to clipboard Provided by the Springer Nature SharedIt content-sharing initiative KEYWORDS * _Populus_ * genetic mapping * comparison mapping
* ecological genetics * hybrid * AFLP