- Select a language for the TTS:
- UK English Female
- UK English Male
- US English Female
- US English Male
- Australian Female
- Australian Male
- Language selected: (auto detect) - EN
Play all audios:
ABSTRACT AIM To explore ethnic variations in social background of successful applicants to undergraduate United Kingdom medical and dental schools. METHOD Retrospective analyses of
University and College Admissions Services data on all students to commence study in pre-clinical medicine and dentistry, during the academic years 1994/5, 1995/6 and 1996/7. Analyses were
undertaken for two categories of social class, namely higher (professional and intermediate) and lower (skilled non-manual, skilled manual, partly skilled, and unskilled) social class.
RESULTS Over 15 thousand students were accepted to study medicine and dentistry during the three-year study period, of which 80% were from high social class backgrounds. More medical (80.9%)
students were from high social class backgrounds than dental (73.3%) students (OR=1.54, 95% CI=1.39, 1.70). Social class differences were observed, with a greater proportion of higher
social class students amongst the white students than amongst the minority ethnic students (OR=1.42, 95% CI=1.30, 1.55). This was more marked in dentistry (OR=1.48, 95% CI=1.22, 1.79) than
in medicine (OR=1.35, 95% CI=1.22, 1.49). More students from higher social class backgrounds were observed in medicine than in dentistry amongst the black (OR=1.55, 95% CI=0.59, 4.00),
Indian (OR=2.04, 95% CI=1.58, 2.62) and white (OR=1.44, 95% CI=1.26, 1.64) groups. CONCLUSIONS Significant inter-ethnic differences are observed in the social background of students entering
medicine and dentistry. Dentistry accepted a greater proportion of students from lower social class backgrounds and from black and minority ethnic groups. You have full access to this
article via your institution. Download PDF SIMILAR CONTENT BEING VIEWED BY OTHERS REFLECTIONS ON ETHNIC DIVERSITY WITHIN A DENTAL DESERT Article 27 September 2024 EXPLORING DENTAL
ACADEMICS' PERCEPTIONS OF AND EXPERIENCE WITH DISCRIMINATION IN THE UK AND IRELAND: A QUALITATIVE STUDY Article Open access 09 August 2023 ADDRESSING RACIAL INEQUALITIES IN DENTAL
EDUCATION: DECOLONISING THE DENTAL CURRICULA Article 12 February 2021 MAIN Access to higher education for all sections of society is a central aim of the UK government's education
strategy.1 The educational debate concerning the minority ethnic community over the past three decades has focused upon issues such as, underachievement of pupils from minority ethnic
backgrounds,2,3 exclusion of young black Caribbean males from the education system4 and lack of participation in higher education by minority ethnic groups.5 Applications to higher education
have shown marked variations between minority ethnic groups and their white counterparts.6,7Changes to the higher education system such as the introduction of registration fees has raised
the concern that fewer students from lower social class groups may apply. However, there is evidence that although there are a number of reasons why young people enter full time education,
the most influential factor is related to their social class background.5,8 Therefore, as ethnic groups vary as to their social class, it may be anticipated there may be differences in entry
into the higher education system by ethnic group. The desire to improve access to higher education is a laudable aim and the increasing number of minority ethnic groups in medical and
dental schools may give weight to the success to such a strategy. Alternatively, the access issue in medicine and dentistry may simply reflect that social class is a more dominant variable
than ethnicity per se. Detailed socio-demographic data on successful applicants to universities and colleges of further education has only recently been collected, and ethnic monitoring was
introduced to the data collected by the University and College Admissions Services (UCAS) in 1994. The aim of this study was to explore ethnic variations in social background of successful
applicants to undergraduate medical and dental schools, in the UK, for the academic years 1994/5, 1995/6 and 1996/7. METHOD University and College Admissions Services (UCAS) provided data on
all students to commence study in pre-clinical medicine and dentistry, during the academic years 1994/5, 1995/6 and 1996/7. Social class was classified as professional, intermediate,
skilled non-manual, skilled manual, partly skilled, and unskilled. The number of students by social group is summarized in Table 1. Analyses were undertaken for two categories of social
class, namely higher (professional and intermediate) and lower (skilled non-manual, skilled manual, partly skilled, and unskilled) social class. Occasionally the higher category was analyzed
separately. Ethnic group followed categories of the 1991 UK census: white, black Caribbean, black African, black other, Indian, Pakistani, Bangladeshi, Chinese, Asian other and other. Due
to small numbers in certain groups, the three black communities were combined, as too were Asian other and other. Ethnic group in Table 2 summarizes the number of students to commence study
in medicine and dentistry. Odds Ratios (OR) with 95% confidence intervals (CI) were evaluated and reported to illustrate differences between subgroups of students. RESULTS Over fifteen
thousand students were accepted to study medicine and dentistry during the three-year study period, of which 80% were from higher social class backgrounds (Table 1). More medical (80.9%)
students were from higher social class backgrounds than dental (73.3%) students (OR=1.54, 95% CI=1.39, 1.70). This observation was made for each year of the study period, with only moderate
variation amongst the years 1995/6 (OR=1.36, 95% CI=1.14, 1.64) and 1996/7 (OR=1.71, 95% CI=1.44, 2.03). Over one quarter (26.7%) of all students were from black and minority ethnic groups
(Table 2), a larger proportion of which were from dentistry (36.2%) compared with medicine (24.8%) (OR=1.72, 95% CI=1.57,1.89). Although true for each year of the study period, the higher
proportion of black and minority ethnic students within dentistry increased year-on-year between 1994/5 (OR=1.67, 95% CI=1.42, 1.97) and 1996/7 (OR=1.78, 95% CI=1.52, 2.08). The largest
minority ethnic group was Indian (11.4%), the smaller groups being black-African, black-Caribbean and black-other at 0.78%, 0.23% and 0.19% respectively; although combined the number of
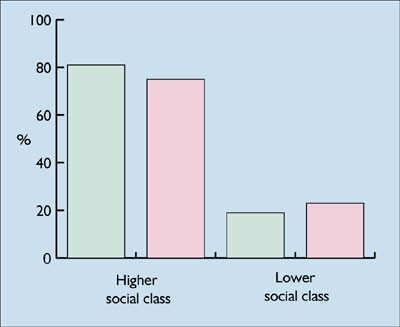
black students (1.2%) was greater than the number of Bangladeshi students (1.0%). Social class differences were observed (Figure 1), with a greater proportion of higher social class students
amongst the white students than amongst the minority ethnic students (OR=1.42, 95% CI=1.30, 1.55). This was more marked in dentistry (OR=1.48, 95% CI=1.22, 1.79) than in medicine (OR=1.35,
95% CI=1.22, 1.49). Examining professional and intermediate social class groups separately, there were both marked similarities and differences by ethnic group (Figure 2). Students from the
black communities had a very similar social class profile to that of white students, whilst more students from professional than intermediate backgrounds were observed for the Indian
(OR=1.54, 95% CI=1.32, 1.80) and Bangladeshi (OR=1.28, 95% CI=0.79, 2.10) communities than for any other ethnic group. However, those from lower social class backgrounds remained the
majority amongst the Bangladeshi students. Thus black, Indian and white students were generally similar, with fewer students from lower social class backgrounds, whereas students from lower
social class backgrounds formed the majority amongst the Bangladeshi, Chinese and Pakistani. The similarity of social class structure between black, Indian and white students differed
between medicine and dentistry (Figure 3). More students from higher social class backgrounds were observed in medicine than in dentistry amongst the black (OR=1.55, 95% CI=0.59, 4.00),
Indian (OR=2.04, 95% CI=1.58, 2.62) and white (OR=1.44, 95% CI=1.26, 1.64) groups. In contrast, there was less similarity of social class structure amongst Bangladeshi, Chinese and Pakistani
students, and this also differed for medicine and dentistry (Figure 4). It was observed that generally more students from higher social class backgrounds studied medicine than dentistry
amongst the Bangladeshi (OR=1.73, 95% CI=0.56, 5.42), Chinese (OR=1.64, 95% CI=0.76, 3.52) and Pakistani (OR=1.42, 95% CI=0.94, 2.15) groups. However, these latter differences were not
formally significant, possibly due to the smaller number of students in each of these ethnic groups. This was reflected by wide confidence intervals given to the ORs. DISCUSSION The results
of the study show that approximately 80% of the students accepted to study medicine and dentistry during the study period were from higher social class backgrounds. Dentistry had a better
record than medicine in accepting students from lower social class backgrounds and from black and minority ethnic groups. Social class differences between the ethnic groups were observed,
with a greater proportion of the white group allocated to a higher social class group. Dentistry recruited more minority ethnic individuals from a lower social class group than did medicine.
The Bangladeshi group was the most likely group to have students from lower social class backgrounds, with the Chinese and Pakistani students also being more likely to come from lower
social class backgrounds. The introduction of ethnic monitoring (according to the 1991 census classification) has helped in observing inter ethnic differences in those who are accepted to
study medicine and dentistry. This study's findings show significant inter-ethnic differences in social background amongst black and minority ethnic groups entering medicine and
dentistry. These differences could potentially mask inequalities in access and uptake of higher education where black and minority ethnic groups are considered together. McManus (1998), in a
recent investigation of bias among applicants to medical schools, showed that even when academic achievement is taken into account, minority ethnic candidates are less likely to be
accepted.9 He also noted older applicants and those from lower socio-economic groups are also disadvantaged. These findings add to the ongoing debate on the selection process into medical
and dental schools.10,11,12 It is naturally desirable that factors such as medical parents, social class, private education, race, and gender do not become significant predictors of
shortlisting, or interview success, whether unconsciously determined or otherwise.10,11,12 However, it is clear that there is still a strong bias towards higher social class groups, although
dental schools are leading on their policy of allowing greater access to groups such as minority ethnic populations and those from a lower social class groups. Despite this it is imperative
that, as a profession, we ensure open access to all sections of the community and have clear guidelines for the entry into our higher education programmes.12 CONCLUSIONS Significant
inter-ethnic differences are observed in the social background of students entering medicine and dentistry. Students from Bangladeshi, Chinese or Pakistani communities tend to have a lower
social class background. Monitoring of inequalities of access to medicine and dentistry should not consider black and minority ethnic groups as a single entity.14 Therefore, strategies to
improve access to higher education based upon minority ethnic group per se maybe inappropriate. _The authors wish to thank the Universities and Colleges Admission Service for providing the
raw data. In addition, we are grateful to those who have helped in the production of this paper, first and foremost, Dr R Wild, Chief Dental Officer for England. We are also grateful to Drs
Allen and Lowndes (co-chairs, British Dental Association – Transcultural oral health working party), Dr Raj Rayan (former member, Standing Dental Advisory Committee Equal Opportunities
working party), Dr P Vasey (former chair, Standing Dental Advisory Committee Equal Opportunities working party) and Dr Renshaw (chair, Standing Dental Advisory Committee)_. REFERENCES *
Higher Education Funding Council of England's advisory group on access and participation. _Widening Access to Higher Education_. Bristol: Higher Education Funding Council of England,
1996. * Department of Education and Science. _Education for All_. The report of a committee of inquiry into the education of children from ethnic minority groups. London : HMSO, 1985. *
Department of Education and Science. _West Indian Children in Our Schools_. London : HMSO, 1981. * Social Exclusion Unit. _Truancy and School Exclusion_. London: Cabinet Office, 1998. * Drew
D, Gray J, Sime N . _Against the Odds :The education and labour market experiences of black young people_. London : Department of Employment, 1992. Google Scholar * Modood T . _The number
of ethnic minority students in British higher education: Some grounds for optimis_. Oxford Review of Education, 1993; 19: 167–182. Google Scholar * Modood T, Shiner M . _Ethnic minorities
and education: Why are there differential rates of entry?_ London : Policy Studies Institute, 1994. Google Scholar * Burnhill P, Garner C, McPherson A . Parental education, social class and
entry to higher education 1976–88. _J R Stat Soc_ 1990; 153: 233–248. Article Google Scholar * McManus I C . Factors affecting likelihood of applicants being offered a place in medical
schools in the United Kingdom in 1996 and 1997: retrospective study. _Br Med J_ 1998; 317: 1111–1117. Article Google Scholar * Horton R C . Admission to medical school: from audit to
action. _J R Soc Med_ 1986; 79: 504–506. Article Google Scholar * Abbasi K . Is medical school selection discriminatory? Is medical school selection discriminatory? _Br Med J_ 1998; 317:
1097–1098. Article Google Scholar * Powis D . How to do it: select medical students. _Br Med J_ 1998; 317: 1149–1151. Article Google Scholar * Bedi R, Gilthorpe M S . Ethnic and gender
variations in university applicants to United Kingdom medical and dental schools. _Br Dent J_ 2000; 189 (in press) Download references AUTHOR INFORMATION AUTHORS AND AFFILIATIONS * Head, WHO
Collaborating Centre for Disability, Culture and Oral Health. National Centre for Transcultural Oral Health, Eastman Dental Institute, 256 Gray's Inn Road, London, WC1X 8LD, United
Kingdom R Bedi * Senior Research Fellow, WHO Collaborating Centre for Disability, Culture and Oral Health. National Centre for Transcultural Oral Health, Eastman Dental Institute, 256
Gray's Inn Road, London, WC1X 8LD, United Kingdom M S Gilthorpe Authors * R Bedi View author publications You can also search for this author inPubMed Google Scholar * M S Gilthorpe
View author publications You can also search for this author inPubMed Google Scholar ADDITIONAL INFORMATION Refereed Paper RIGHTS AND PERMISSIONS Reprints and permissions ABOUT THIS ARTICLE
CITE THIS ARTICLE Bedi, R., Gilthorpe, M. Social background of minority ethnic applicants to medicine and dentistry. _Br Dent J_ 189, 152–154 (2000). https://doi.org/10.1038/sj.bdj.4800709
Download citation * Received: 05 July 1999 * Accepted: 26 April 2000 * Published: 12 August 2000 * Issue Date: 12 August 2000 * DOI: https://doi.org/10.1038/sj.bdj.4800709 SHARE THIS ARTICLE
Anyone you share the following link with will be able to read this content: Get shareable link Sorry, a shareable link is not currently available for this article. Copy to clipboard
Provided by the Springer Nature SharedIt content-sharing initiative