- Select a language for the TTS:
- UK English Female
- UK English Male
- US English Female
- US English Male
- Australian Female
- Australian Male
- Language selected: (auto detect) - EN
Play all audios:
ABSTRACT A reliable quantitative method for measuring gene product expression is important in investigating the relationship between growth factors and tumor biological behavior. In this
study, we quantified the expression of vascular endothelial growth factor (VEGF) mRNA in 104 paired samples of lung cancer tissue and the surrounding nontumorous lung tissue using a new
kinetic quantitative polymerase chain reaction (PCR) method, ie, real-time quantitative reverse transcription-PCR (RTQ RT-PCR). The samples consisted of 46 squamous cell carcinomas, 50
adenocarcinomas, and 8 undifferentiated cell carcinomas. In 17 cases, the results obtained were compared with those obtained using quantitative competitive RT-PCR (QC RT-PCR). Using RTQ
RT-PCR, VEGF mRNA expression was detected and quantified in all 104 (100%) lung cancer samples and their normal counterparts. VEGF mRNA expression in the lung cancer tissue was significantly
higher than in the normal counterparts (95% CI: 0.575 ∼ 1.727, _p_ < 0.001; paired _t_ test). In 68 (65.4%) cases, VEGF mRNA expression was higher in the cancer tissue than normal
tissue. VEGF mRNA expression was higher in nonsquamous cell carcinoma (_p_ = 0.02), and higher in tumor with hilar or mediastinal lymph node metastasis (_p_ = 0.024). QC RT-PCR was able to
detect and quantify VEGF mRNA expression in 15/17 (88%) lung cancer samples and 12/17 (70.6%) normal tissue samples. The values for VEGF mRNA expression were higher in the tumor in 13 (76%)
cases. Comparison of the values of the VEGF mRNA expression quantified using RTQ RT-PCR or QC RT-PCR showed a good correlation between results obtained using these two methods, both in
cancer tissue (_r_ = 0.68, _p_ = 0.0025) and normal counterpart (_r_ = 0.53, _p_ = 0.027). Agreement between the results for the relative expression of VEGF mRNA expression in cancer and
normal tissue obtained using these two methods was seen in 14/16 cases (88%). We conclude that RTQ RT-PCR is as accurate as QC RT-PCR and is more sensitive than QC RT-PCR in detecting and
quantifying VEGF mRNA expression in lung cancer and normal tissues, and both methods reveal that the VEGF mRNA expression is higher in lung cancer tissue than in healthy lung tissue. SIMILAR
CONTENT BEING VIEWED BY OTHERS LACK OF IMBALANCE BETWEEN THE MASTER REGULATORS _TTF1/NKX2-1_ AND _ΔNP63/P40_ IMPLIES ADVERSE PROGNOSIS IN NON-SMALL CELL LUNG CANCER Article Open access 30
January 2024 KRT13 AND UPK1B FOR DIFFERENTIAL DIAGNOSIS BETWEEN METASTATIC LUNG CARCINOMA FROM ORAL SQUAMOUS CELL CARCINOMA AND LUNG SQUAMOUS CELL CARCINOMA Article Open access 18 December
2023 EXPRESSION OF INFLAMMATORY INTERLEUKINS AND SELECTED MIRNAS IN NON-SMALL CELL LUNG CANCER Article Open access 03 March 2021 INTRODUCTION Tumor angiogenesis is important in tumor growth
and metastasis. Intratumor microvessel counts have been shown to associate with tumor progression in several types of human cancers, such as brain, breast, gastric, renal, and lung cancers
(Folkman et al, 1971; Horak et al, 1992; Macchiarini et al, 1992; Srivasta et al, 1988; Weidner et al, 1991). Several angiogenic factors are involved in the process of tumor-associated
angiogenesis (Weiner, 1995). Vascular endothelial growth factor (VEGF) is known to be one of the most important angiogenic factor in various physiologic and pathologic conditions (Berkman et
al, 1993; Brown et al, 1993, 1995; Suzuki et al, 1996; Takahashi et al, 1995). Assessment of the overexpression of the VEGF gene product in cells or tissue is important in studying the role
of VEGF in the angiogenesis process. Several methods for measuring VEGF expression in tissues or cells have been reported. At the protein level, immunohistochemical staining (IHC) has been
used for semiquantitative analysis of VEGF expression (Fontanini et al, 1997) and ELISA has been used to quantify cytosolic VEGF protein expression (Chen et al, 1999). At the transcriptional
level, Northern blots and polymerase chain reaction (PCR)-based quantitative methods have been used to assess VEGF mRNA expression in tissues (Gu et al, 1999). PCR-based quantification
methods have proved to be powerful tools for the quantitative analysis of the copy number of a given target gene or mRNA, especially when only a limited amount of tissue is available, as in
a small early-stage tumor or an aspiration biopsy specimen (Clementi et al, 1993; Ferre, 1992). Quantitative reverse transcription-PCR (RT-PCR) is conventionally performed by evaluating the
amount of product after a given number of cycles (end-point quantitative PCR) (Ohta et al, 1996). Recently, quantitative competitive RT-PCR (QC RT-PCR), in which an internal DNA competitor
competes with the sample cDNA for co-amplification by the same primers, has been developed and shown to be a more accurate method for the quantification of cDNA (Doldrini et al, 1999; Piatak
et al, 1993; Raeymaekers, 1995). A novel approach of quantitative polymerase chain reaction using real-time detection has been developed recently, that is, real-time quantitative RT-PCR
(RTQ RT-PCR) (Heid et al, 1996). RTQ RT-PCR uses the 5′ nuclease activity of _Taq_ polymerase to cleave a dual-labeled fluorogenic hybridization probe during the extension phase of PCR
(Holland et al, 1991), the fluorescence released after cleavage being used to quantify the nucleic acid in the samples (Gibson et al, 1996). It is reported to be able to detect low-level
gene amplification (myc, ccnd1, and erb B2) in breast cancer tissue (Ivan et al, 1998) and to quantify tumor necrosis factor-α (TNF-α) mRNA expression in laser-assisting picked alveolar
macrophages after lipopolysaccharide (LPS) stimulation (Fink et al, 1998). The use of RTQ RT-PCR to quantify VEGF mRNA expression has not been previously reported. In the present study, we
used this method to assess VEGF mRNA expression in matched tumor and healthy lung tissue samples from 104 patients with non-small cell lung cancer (NSCLC). The purposes of this study were
(a) to evaluate the levels of expression of VEGF mRNA in lung cancer tissue and the surrounding healthy tissue, and (b) to compare the sensitivity and accuracy of RTQ RT-PCR with those of QC
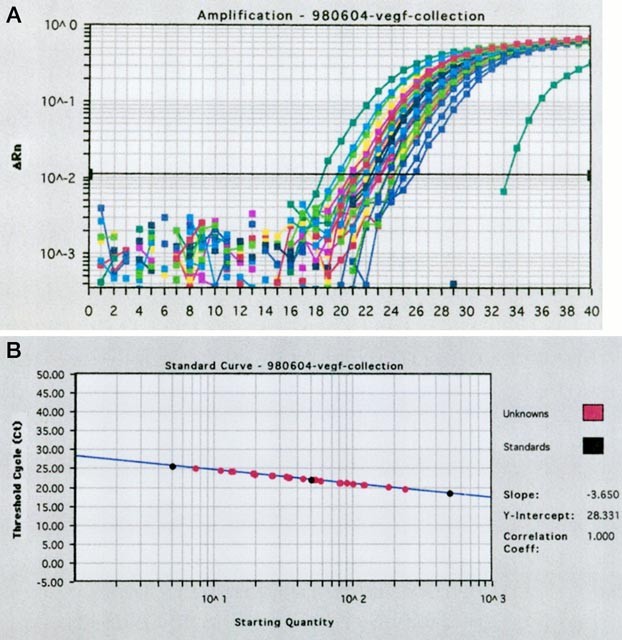
RT-PCR in the quantification of VEGF mRNA. RESULTS VALIDATION OF THE STANDARD CURVE AND DYNAMIC RANGE OF REAL-TIME QUANTITATIVE RT-PCR The standard curve was constructed using serial
dilutions of RT-PCR products of the standard sample containing 500, 100, 50, or 5 ng of product. Figure 1 shows the RTQ RT-PCR standard curve for VEGF mRNA. The regression coefficient for
the regression line plotting the threshold cycle (CT) against the starting amount of the standard sample ranged from 0.997 to 1.000. The intra-assay and inter-assay coefficients of variation
were 6.5% and 7.9%, respectively. The design of the primers and the thermocycling conditions ensured that no genomic DNA was amplified and detected during this reaction (data not shown).
VEGF MRNA EXPRESSION IN LUNG CANCER AND HEALTHY LUNG TISSUE ASSESSED BY RTQ RT-PCR The VEGF mRNA expression ratio (amount of VEGF mRNA/amount of β-actin mRNA) is expressed as −ΔCT = −(CT
VEGF − CT β-actin). The −ΔCT values for VEGF in 104 samples of lung cancer tissue ranged from 2.45 to 14.8, with a mean ± standard deviation (sd) of 9.7 ± 2.34, while the corresponding
values in the matched nontumorous lung tissue ranged from 1.0 to 13.88, with a mean ± sd of 8.58 ± 2.23. VEGF mRNA expression in lung cancer tissue was significantly higher than in the
matched nontumorous lung tissue (95% CI: 0.575∼1.727, _p_ < 0.001, paired _t_ test) (Table 1). VEGF mRNA expression was detected in all 104 (100%) paired lung cancer and nontumorous lung
tissue samples by RTQ RT-PCR, and was higher in the tumor tissue than in the nontumorous material in 68 patients (65.4%) and lower in 36 (35.6%). An immunohistochemical study of VEGF
expression was performed on 72 samples of lung cancer and nontumorous lung tissue. Staining for VEGF was mainly located in the cancer cell cytoplasm in tumor tissue (Fig. 2A), whereas, in
the nontumorous lung tissue, the bronchial epithelium showed positive staining (Fig. 2B). The percentage of tumor tissue that showed positive VEGF protein immunohistochemical staining ranged
from 10% to 100%, with mean ± standard deviation as 79.2% ± 27.2%. When we correlated the percentage of tumor tissue that showed positive VEGF protein expression with VEGF mRNA quantified
by RTQ RT-PCR, we found that there was a good correlation (_r_ = 0.36953, _p_ = 0.0034, linear regression) between the VEGF mRNA expression and VEGF protein expression in the tumors.
RELATIONSHIP BETWEEN VEGF MRNA EXPRESSION AND CLINICOPATHOLOGIC VARIABLES Table 1 shows the relationship between VEGF mRNA expression and the clinicopathologic characteristics. VEGF mRNA
expression was higher in nonsquamous cell carcinoma than in squamous cell carcinoma (−ΔCT = 10.28 ± 2.26 vs 9.26 ± 2.12; _p_ = 0.02, independent _t_ test) and was higher in tumors with hilar
and/or mediastinal metastasis (N2–3) than without (N0–1: no lymph node metastasis or only regional lymph node metastasis) (10.38 ± 2.07 vs 9.39 ± 2.27; _p_ = 0.024, independent _t_ test).
The relationship between VEGF mRNA expression and age, sex, stage, or tumor status was not statistically significant. QUANTIFICATION OF VEGF MRNA EXPRESSION USING QC RT-PCR Seventeen paired
lung cancer and nontumorous tissue samples were randomly selected for quantification of VEGF mRNA expression using QC RT-PCR. Examples of the QC RT-PCR for VEGF and G β-like cDNA are shown
in Figure 3A and B. The ethidium bromide-stained electrophoresis gel showed competition between the PCR products of the native RNA and the serial dilutions of internal competitor RNA for
both the VEGF and G β-like genes. Linear regression was used to calculate the amount of VEGF cDNA (Fig. 3C). Since the starting amounts of native VEGF cDNA and internal competitor are equal
when the ratio of their PCR products is 1 (log ratio = 0), the amount of native VEGF mRNA can be calculated from the amount of internal competitor at the point where the regression line
intersects the x axis. The regression coefficient for the linear regression line in the QC RT-PCR assay ranged from −0.948 to −1.000 and the intra-assay and inter-assay coefficients of
variation were 10.4% and 16.8%, respectively. The VEGF mRNA/housekeeping gene (G β-like) expression ratio in cancerous and nontumorous lung tissue are shown in Table 2. In lung cancer
material, this ranged from 0 to 944, with a mean ± sd of 109.9 ± 237.6, whereas in the nontumorous material, it ranged from 0 to 87.3, with a mean ± sd of 23.1 ± 32.3. VEGF mRNA expression
in lung cancer tissue was higher than in nontumorous lung tissue, although the difference was not statistically significant (95% CI: −36.1 to 209.6; _p_ = 0.153, paired _t_ test). VEGF mRNA
expression was detected in 15/17 (88%) samples of lung cancer tissue and in 12/17 (70.6%) samples of nontumorous lung tissue. VEGF mRNA was not detected by QC RT-PCR in 7/34 (20.6%) samples.
The VEGF mRNA expression ratio was higher in lung cancer tissue than in nontumorous material in 13 (76.4%) patients and lower in 3 (17.6%). In one patient, no VEGF mRNA was detected by QC
RT-PCR in either the lung cancer sample or nontumorous sample. Expression of the house-keeping gene G β-like mRNA was detected in all samples of cancerous and nontumorous lung tissue.
COMPARISON OF VEGF MRNA EXPRESSION DETECTED BY RTQ RT-PCR AND QC RT-PCR We compared the VEGF mRNA expression ratios determined by RTQ RT-PCR or QC RT-PCR in 17 paired lung cancer and
nontumorous samples (Table 2). A good correlation was seen between the values for VEGF mRNA determined by RTQ RT-PCR or QC RT-PCR in both lung cancer tissue (_r_ = 0.68, _p_ = 0.0025) and
nontumorous lung tissue (_r_ = 0.53, _p_ = 0.027). The −ΔCT value for VEGF mRNA was higher in lung cancer tissue than in the nontumorous tissue in 12 (71%) patients and lower in 5 (29%). The
VEGF mRNA expression ratio assessed by QC RT-PCR was higher in lung cancer tissue than in nontumorous material in 13 (76.4%) patients and lower in 3 (17.6%), and for one patient, there was
no VEGF mRNA detected in either tissue sample. A good agreement between these two quantitative PCR methods in terms of the relative amounts of VEGF mRNA expression in lung cancer and
nontumorous tissues was seen in 14/16 patients (88%). For one patient, the relationship could not be determined because VEGF mRNA was not detected by QC RT-PCR in either sample. DISCUSSION
Angiogenesis is important in the growth and progression of solid tumors and is a critical step in the process of systemic metastasis (Schor and Schor, 1983). Recently it has been reported to
be associated with an increased incidence of metastasis and a worse prognosis in cancers of several organs, eg, gastric, breast, renal, and primary lung cancers (Folkman et al, 1971; Horak
et al, 1992; Macchiarini et al, 1992; Srivasta et al, 1988; Weidner et al, 1991). VEGF is one of the most important angiogenic factors and is an endothelial cell-specific mitogen. It is
therefore important to be able to assess VEGF gene product expression in tumor cells in order to understand the role of VEGF in tumor angiogenesis and in the biological behavior of tumors.
Many studies of VEGF expression in various malignancies have been performed in recent years (Berkman et al, 1993; Boocock et al, 1995; Fontanini et al, 1997; Ohta et al, 1996, 1997; Oshika
et al, 1994; Suzuki et al, 1996; Tokunaga et al, 1998; Viglietto et al, 1996). Gene product expression has been mainly studied by assessment of mRNA or protein expression. Northern blotting
has been used to assess mRNA expression, but it is not sensitive enough and requires relatively large amounts of high-quality total RNA (5–10 μg/reaction). PCR has recently been used to
amplify the target cDNA and to determine the amount of a specific mRNA from a minimal amount of a tissue sample or a small number of cells. Several PCR-based methods have been developed to
quantify mRNA overexpression in tumors. The conventional quantitative RT-PCR assay measures the end product of PCR amplification after a given number of cycles (end-point quantitative
RT-PCR). An internal control mRNA (housekeeping gene) is required to determine PCR efficiency. In addition, for effective quantification, the reaction must be stopped before amplification
reaches the plateau phase (oversaturation) (Kellogg et al, 1990), so serial dilutions of the sample must be employed to ensure that the linear part of the curve is used. Despite these
problems, it is currently the most frequently used method. QC RT-PCR, recently developed and now widely used for PCR quantification, relies on the co-amplification of the target mRNA with an
internal competitor. Serial dilutions of a known concentration of internal competitor are added to the sample. For relative quantification, the unknown target PCR products are compared with
the known competitor PCR products. The starting amount of target cDNA is assumed to be equal to the starting amount of internal competitor when the amounts of their PCR products are equal.
The aims of this competitive approach are to circumvent the problems of the different annealing efficiencies of different primer sets and provide a more accurate standard for quantification
of nucleic acid. The success of a quantitative competitive PCR assay relies on developing an internal competitor that amplifies with the same efficiency as the target molecule. The internal
competitor can be designed using a homologous or nonhomologous DNA fragment that contains the same primer templates as the target cDNA. Because of its accuracy in quantification, QC RT-PCR
is being increasingly used to quantify mRNA expression (Doldrini et al, 1999; Piatak et al, 1993; Raeymaekers, 1995). In this study, we used RTQ RT-PCR to quantify VEGF mRNA expression in
104 (100%) lung cancer samples. The characteristics of this method are that it quantifies the PCR product when PCR amplification is still in the exponential phase (kinetic quantitative PCR),
rather than the PCR end product (Gibson et al, 1996; Heid et al, 1996; Holland et al, 1991; Ivan et al, 1998), and it has been shown to be a more reliable method for quantifying the
starting copy number of target molecules than the end product method. The results were positive in all 104 (100%) lung cancer and nontumorous healthy tissue samples. For comparison, QC
RT-PCR was performed on 17 paired samples and was able to detect VEGF mRNA expression in 15/17 (88%) lung cancer samples and 12/17 (76%) nontumorous samples. Higher VEGF mRNA expression by
the tumor was seen in 13 cases (76%) by QC RT-PCR compared with 12 cases (71%) by RTQ RT-PCR. There was a good correlation between the values for VEGF mRNA expression obtained using the two
methods (_p_ < 0.05). There was also a good agreement between the two methods in terms of determining relative VEGF mRNA expression in the lung cancer and nontumorous lung tissue in 14
paired tissue samples. The results showed that RTQ RT-PCR is as accurate as QC RT-PCR in quantifying VEGF mRNA in tumor and healthy tissue. Ohta et al (1996) assessed VEGF mRNA expression in
primary lung cancer using the conventional quantitative RT-PCR method and detected VEGF mRNA in 29/42 (71%) samples of cancer tissue. Doldrini et al (1999) reported the use of QC RT-PCR to
quantify VEGF mRNA expression in cancer and normal tissue samples from 22 patients with non-small cell lung cancer (NSCLC), all of which were known to be positive for VEGF expression by
qualitative RT-PCR. They detected VEGF mRNA in 18 samples of healthy tissue and in all samples of tumor tissue and found VEGF expression to be higher in the tumor than in the matched healthy
tissue in 17 cases. However, using QC RT-PCR, no VEGF PCR product was detected in 4/22 (18.4%) samples of healthy lung tissue, although all these healthy tissue samples were positive for
VEGF mRNA expression assessed by qualitative RT-PCR. These results showed that, despite the advantage of accuracy in quantification, QC RT-PCR was no more sensitive than conventional RT-PCR
in detecting VEGF mRNA in tissues, the overall sensitivity being about 91% in this series. Further serial dilution of the internal competitor may be required to measure tiny amounts of VEGF
mRNA in normal tissue. In our study, when QC RT-PCR was performed on 17 pairs of lung cancer and nontumorous lung tissue samples, VEGF mRNA expression was detected and quantified in 15/17
(88%) samples of lung cancer tissue and in 12/17 (76%) samples of nontumorous lung tissue, the overall sensitivity being around 79.4%. In contrast, RTQ RT-PCR was able to detect and quantify
VEGF mRNA expression in all 104 (100%) paired samples in our study. Furthermore, the starting amount of total RNA used for RTQ RT-PCR was 50 ng, much lower than the amount (6 μg) required
for QC RT-PCR. These results show that, in terms of detecting VEGF mRNA expression, RTQ RT-PCR is the most sensitive of these three PCR-based quantitative methods. The high sensitivity of
this method may be due to its wide dynamic range for quantification and the sensitivity of the fluorescence method used during the process of PCR amplification (Ivan et al, 1998). RTQ RT-PCR
has several additional advantages over other PCR-based assays. (a) It gives more precise and reproducible mRNA quantification because it is based on the CT value rather than end-point
measurement of the amount of accumulative PCR product. (b) It has a linear dynamic range of at least four orders of magnitude. (c) It can avoid carry-over contamination of amplified product
using the enzyme uracil N-glycosylase (UNG) (Longo et al, 1990). (d) Unlike QC RT-PCR, it does not require the design and storage of an internal competitor or the validation of the
amplification efficiency of the internal competitor. (e) It does not require post-PCR manipulation, thus making sample analysis simple and rapid. (f) It is able to analyze large numbers of
samples in one reaction (Celi et al, 1994). VEGF mRNA has at least four isoforms (VEGF121, VEGF165, VEGF189, and VEGF206), which are derived by alternative splicing of a single gene (Dvorak
et al, 1995). These four isoforms have a common sequence in exon 1–5 and exon 8 (Tokunaga et al, 1998). Using different fluorescent reporter molecules in probes that hybridize specifically
with different isoforms, RTQ RT-PCR can quantify each of the four VEGF mRNA isoforms in a single reaction. The quantification of nucleic acid by QC RT-PCR is based on competition between two
similar cDNA templates (target DNA and competitor). However, when more than two target sequence isoforms are present, calculation of the amount of any one isoform might be difficult. This
might be a further advantage of RTQ RT-PCR over QC RT-PCR, especially when multiple mRNA isoforms have to be quantified in the same sample. We conclude that RTQ RT-PCR is as accurate as, and
may be more sensitive than, QC RT-PCR in the quantification of VEGF mRNA expression in NSCLC and that RTQ RT-PCR can be used as an additional reliable method of assessing gene product
expression in clinical research. MATERIALS AND METHODS PATIENTS, TISSUE SAMPLES AND RNA EXTRACTION Samples were obtained from 104 primary lung carcinomas, resected surgically from patients
at this institution (National Taiwan University Hospital) between 1994 and 1996. The patients consisted of 68 men and 36 women, with a mean age of 58.2 ± 12.4 years. The histologic
classification of lung cancer was determined as recommended by the World Health Organization (WHO, 1982) and tumor staging was performed according to the TMN staging system (Mountain, 1986).
The cancer specimens included 46 squamous cell carcinomas, 50 adenocarcinomas, and 8 undifferentiated carcinomas. Tumor staging was I in 36 cases, II in 20 cases, IIIA or IIIB in 47 cases,
and IV in 1 case (Table 3). Immediately after surgery, the tumor samples and surrounding healthy lung tissue were placed in liquid nitrogen and stored frozen at −80° C. A RNA extraction kit
(Rneasy Mini Kit; Qiagen, Valencia, California) was used to extract total mRNA from the resected lung tissue. REAL-TIME QUANTITATIVE RT-PCR THEORETICAL BASIS This method (TaqMan reaction) is
based on the 5′ nuclease activity of _Taq_ polymerase, which cleaves a specific dual-labeled fluorogenic hybridization probe during the extension phase of PCR. As long as this
sequence-specific probe is intact, emission by a reporter dye at its 5′ end is quenched by a second fluorescent dye at the 3′ end. During the extension phase of the PCR, _Taq_ polymerase
hydrolyzes the probe and releases the reporter dye, resulting in an increase in peak fluorescence emission that is directly proportional to the number of amplified copies and is detected and
quantified by a detector in real-time. A higher starting copy number of the nuclear acid results in an earlier increase in fluorescence. The threshold cycle (CT) is defined as the
fractional cycle number at which the fluorescence generated by cleavage of the probe exceeds a fixed threshold above baseline (Fig. 1A and B). For a chosen threshold, a smaller starting copy
number results in a higher CT value. In this study, we used RTQ RT-PCR for the relative quantification of VEGF mRNA in tumor specimens, using β-actin mRNA as an internal control. PRIMERS,
PROBES, AND REFERENCE INTERNAL CONTROL MRNA Primers and probes were chosen using the computer program, Primer Express (Perkin-Elmer Applied Biosystems, Forster City, California). Primers and
probes were synthesized and bought from Perkin-Elmer Applied Biosystems. Based on the cDNA sequence (Gene bank, accession No. m32977), the primers used for RTQ RT-PCR of VEGF mRNA were as
follows: (a) forward primer, 5′-GCA CCC ATG GCA GAA GG-3′ (in exon 2) and (b) reverse primer: 5′-CTC GAT TGG ATG GCA GTA GCT-3′ (in exon 3). The sequence of the probe for detection and
quantification of PCR product was as follows: 5′-ACG AAG TGG TGA AGT TCA TGG ATG TCT ATC AC-3′, which was spanning the exon2∼exon3 junction. This sequence was chosen to eliminate the
quantification of PCR product of contaminated VEGF genomic DNA. β-actin mRNA (internal control) in the tumor sample was quantified in the same way, using forward and reverse primers and a
probe designed for β-actin mRNA analysis. The forward primer sequence for β-actin mRNA quantification was 5′-CGC CCA GCA CGA TGA AA-3′; the reverse primer sequence was 5′-CCG CCG ATC CAC ACA
GA-3′; and the probe sequence was 5′-AAG ATC ATT GCT CCT CCT GAG CGC AAG T-3′. STANDARD CURVE SAMPLE PREPARATION The standard curve samples used for RTQ RT-PCR were prepared by serial
dilution of a specific RNA sample to cover the range of 500 ng to 5 ng. The serially diluted samples were aliquotted and stored at −80° C until use. RT-PCR PROCEDURE The amplification
mixture (50 μl) contained 50 ng of sample RNA, 5 × TaqMan EZ buffer (10 μl), 25 mm manganese acetate (6 μl), 300 μm deoxyadenosine triphosphate (dATP) deoxycytidine triphosphate (dCTP),
deoxyguanosine triphosphate (dGTP), and 600μm deoxyuridine triphosphate (dUTP), 5 units of rTth DNA polymerase, 0.5 units of AmpErase uracil N-glycosylase (UNG), 200 nm VEGF forward and
reverse primers, and 100 nm VEGF probe (Perkin-Elmer Applied Biosystems). The rTth DNA polymerase had both RTase and _Taq_ polymerase activity. The thermal cycling parameters were as
follows: initial step of 2 minutes at 50° C, 30 minutes at 60° C for reverse transcription, 5 minutes at 95° C for deactivation, and then 40 cycles at 94° C for 20 seconds and 62° C for 1
minute for the melting, annealing, and extending phases of the PCR reaction. Each assay included standard curve samples in duplicate, a no-template control, and about 50 ng of sample total
RNA in triplicate. All samples with a coefficient of variation (CV) higher than 10% were retested. DETECTION OF FLUORESCENCE EMISSION AND QUANTIFICATION OF VEGF MRNA The fluorescence
emission from the reporter dye (FAM-6-carbosy-fluorescein, peak fluorescence emission at 518 nm) was detected on-line using an ABI prism 7700 sequence detection system (Perkin-Elmer Applied
Biosystems) in real time. The amount of VEGF mRNA in the tissue, standardized to the β-actin mRNA, was expressed as −ΔCT = −(CT VEGF − CT β-actin). The ratio of the amount of VEGF
mRNA/amount of β-actin mRNA was then calculated as 2 −ΔCT × K (K, constant). IMMUNOHISTOCHEMICAL STAINING OF VEGF Expression of VEGF protein was assessed by immunohistochemical staining,
using a modified version of the avidin-biotin peroxidase complex method (Yuan et al, 1995). The percentage of tumor tissue that showed positive VEGF staining was counted randomly on five ×
200 fields (Volm et al 1997). QUANTITATIVE COMPETITIVE RT-PCR CONSTRUCTION OF THE COMPETITIVE FRAGMENTS USED FOR QC RT-PCR The competitive templates for amplification of the VEGF and G
β-like genes (housekeeping gene as an internal control) were complementary RNA (cRNA) fragments produced by _in vitro_ transcription of the mutated DNA fragment constructed using the PCR
technique developed by Celi and Dong (Celi et al, 1993; Dong et al, 1993). Table 4 summarizes the primer sets used for generating both mutated and native PCR fragments of the VEGF gene and G
β-like gene. The mutated PCR fragments were ligated into the T7 vector and _in vitro_ transcription was performed using T7 RNA polymerase. The details of the procedure have been published
(Yu et al, 1998). The sizes of the PCR products for the mutated VEGF and G β-like DNA fragments (internal competitor) were 339 and 225 base pairs, respectively. _IN VITRO_ TRANSCRIPTION OF
RNA TEMPLATES (INTERNAL COMPETITOR) FOR QC RT-PCR Ten micrograms of T7 vector was cloned with each specific mutated PCR fragment. After electrophoresis on a 1% agarose gel, the bands were
extracted with phenol-chloroform and alcohol precipitated, and the material was dissolved in water treated with diethyl pyrocarbonate (DEPC-H2O). A measured amount (3.75 μg) of the material
was added to 20 μl of first strand reaction mixture (200 mm Tris-HCl, 30 mm MgCl2, 10 mm spermicide, 10 mm dithiothreitol), 100 U of RNAsin (Rnase inhibitor 400 U/μl; Promega, Madison,
Wisconsin), nucleoside triphosphates (NTPs) (50 mm ATP, CTP, GTP, UTP), and 40 U of T7 RNA polymerase in a total reaction volume of 100 μl. After incubation at 39° C for 2 hours, 4 U of
Rnase-free DNase RQ-1 was added, and the mixture incubated at 37° C for 15 minutes to degrade the DNA template. After phenol-chloroform-isoamyl alcohol elution and alcohol precipitation, the
RNA transcript was dissolved in 20 μl of DEPC-H2O. After spectrophotometric measurement of the concentration, the RNA was serially diluted and stored at −70° C. The cRNA transcripts are
referred to as the internal competitors (standards) for the VEGF and G β-like genes for the QC RT-PCR. QC RT-PCR Seventeen matched samples of lung cancer material and the surrounding normal
tissue were randomly selected for QC RT-PCR to measure VEGF mRNA expression. The total RNA was extracted using the method described above. Six micrograms of tissue total RNA was added to 8
μg of random primer in a final volume of 10 μl. A measured amount (1.25 μl) of this mixture was added to each of 8 tubes containing, respectively, 1,000, 300, 100, 30, 10, 3, 1, or 0.3 pg of
target gene RNA internal competitor. The RT reaction was carried out in a final volume of 6.25 μl, with the addition of a reaction mixture containing Superscript RTase (BRL, Gaithersburg,
Maryland), Rnasin, dNTP, dithiothreitol, and 5 × reaction buffer. After reaction at 37° C for 90 minutes, the RT products were diluted with 12 μl of deionized distilled water and heated at
85° C for 5 minutes. Two microliters of RT products from each tube were used for PCR in a volume of 20 μl (including _Tag_ polymerase, MgCl2, 10 × buffer, dNTP, and primers for VEGF or G
β-like gene). The thermocycle conditions for the VEGF and G β-like genes are listed in Table 4. After amplification, the PCR products were electrophoresed at 80 V for 1 to 2 hours on a 6%
nondenaturing polyacrylamide gel, stained with 5 μg/ml ethidium bromide solution for 3 minutes, and destained. The signal intensities of the amplified native and mutated products were
directly measured and digitized using an Is-1000 digital imaging system (Alpha Innotech Corporation, San Leandro, California). Using quantitative densitometry, the intensities of the native
and mutant VEGF gene products were plotted as a function of the known amounts of mutant templates. When the intensities of the native and mutated gene products were equal, the molecules of
the native VEGF mRNA transcript were equal to those of the mutant template. The amounts of VEGF mRNA were then corrected by the amounts of G β-like mRNA transcript, determined by the same
method. The VEGF mRNA expression ratio was defined as the amount of VEGF mRNA divided by the amount of G β-like mRNA. STATISTICS The presence of VEGF mRNA detected by RTQ RT-PCR or QC RT-PCR
in lung cancer material and the corresponding healthy tissue was expressed as a frequency (number of positive results in the total number of samples). The correlation between the levels of
expression of VEGF mRNA measured by RTQ RT-PCR or by QC RT-PCR was analyzed by linear regression (Glantz, 1992). The percentage of tumor tissue that showed positive VEGF staining was also
correlated with the VEGF mRNA expression quantified by RTQ RT-PCR using linear regression. Statistical tests were performed using the software SPSS 8.0 (SPSS Inc., Chicago, Illinois).
ACCESSION CODES ACCESSIONS GENBANK/EMBL/DDBJ * m32977 REFERENCES * Berkman RA, Merril MJ, Reinhold WC, Monacci WT, Saxena A, Clark WC, Robertson JT, Ali IU, and Oldfield EH (1993).
Expression of the vascular permeability factor/vascular endothelial growth gene in central nervous system neoplasms. _J Clin Invest_ 91: 153–159. Article CAS PubMed PubMed Central Google
Scholar * Boocock CA, Charnock-Jones DS, Sharkey AM, Mclaren J, Barker PJ, Wright KA, Twentyman PR, and Smith SK (1995). Expression of vascular endothelial growth factor and its receptors
flt an KDR in ovarian carcinoma. _J Natl Cancer Inst_ 87: 506–516. Article CAS PubMed Google Scholar * Brown LF, Berse B, Jackman RW, Tognazzi K, Guidi A, Dvorak H, Senger D, Connolly J,
and Schnitt S (1995). Expression of vascular permeability factor (vascular endothelial growth factor) and its receptors in breast cancer. _Hum Pathol_ 26: 86–91. Article CAS PubMed
Google Scholar * Brown LF, Berse B, Jackman RW, Tognazzi K, Manseau EJ, Senger DR, and Dvorak HF (1993). Expression of vascular permeability factor (vascular endothelial growth factor) and
its receptors in adenocarcinomas of the gastrointestinal tract. _Cancer Res_ 53: 4727–4735. CAS PubMed Google Scholar * Celi FS, Cohen MM, Antonarakis SE, Werithemer E, Roth J, and
Shuldiner AR (1994). Determination of gene dosage by a quantitative adaptation of the polymerase chain reaction (gdPCR): rapid detection of deletions and duplications of gene sequences.
_Genomics_ 21: 304–310. Article CAS PubMed Google Scholar * Celi FS, Zenilman ME, and Shuldiner AR (1993). A rapid and versatile method to synthesize internal standards for competitive
PCR. _Nucleic Acid Res_ 21: 1047. Article CAS PubMed PubMed Central Google Scholar * Chen CA, Cheng WF, Lee CN, Chen TM, Kung CC, Hsieh FJ, and Hsieh CY (1999). Serum vascular
endothelial growth factor in epithelial ovarian neoplasms: Correlation with patient survival. _Gynecol Oncol_ 74: 235–4. * Clementi M, Menzo S, Bagnarelli P, and Manzin A (1993).
Quantitative PCR and RT-PCR in virology. _PCR Methods Appl_ 2: 191–196. Article CAS PubMed Google Scholar * Doldrini L, Calcinal A, Silverstri V, Basolo F, Lucchi M, Mussi A, Angeletti
CA, Bevilacqua G, and Fontanini G (1999). Quantitation by competitive PCR assay of vascular endothelial growth factor in non-small cell lung carcinoma. _Int J Oncol_ 14: 161–8. * Dong G, Yu
M, and Smith HS (1993). An improved method of competitive PCR for quantitation of gene copy number. _Nucleic Acids Res_ 21: 4848–4849. Article Google Scholar * Dvorak HF, Brown LF, Dermar
M, and Dvorak AM (1995). Vascular permeability factor/vascular endothelial growth factor, microvascular hyperpermeability, and angiogenesis. _Am J Pathol_ 146: 1029–1039. CAS PubMed PubMed
Central Google Scholar * Ferre F (1992). Quantitative or semi-quantitative PCR: Reality versus myth. _PCR Methods Appl_ 2: 1–9. Article CAS PubMed Google Scholar * Fink L, Seeger W,
Ermert L, Hanze J, Stahl FG, Kummer W, and Bohle R (1998). Real-time quantitative RT-PCR after laser-assisted cell picking. _Nat Med_ 4: 1329–1333. Article CAS PubMed Google Scholar *
Folkman J, Merler E, Anbemathy C, and Williams G (1971). Isolation of a tumor factor responsive for angiogenesis. _J Exp Med_ 33: 275–278. Article Google Scholar * Fontanini G, Vignati S,
Boldrini L, Chine S, Silvestri V, Lucchi M, Mussi A, Angeletti CA, and Bevilacqua G (1997). Vascular endothelial growth factor is associated with neovascularization and influences
progression of NSCLC. _Clin Cancer Res_ 3: 861–865. CAS PubMed Google Scholar * Gibson UEM, Heid CA, and Willian PM (1996). A novel method for real-time quantitative RT-PCR. _Genome Res_
6: 995–1001. Article CAS PubMed Google Scholar * Glantz SA (1992). Alternatives to analysis of variance and the _t_ test based on ranks. In: Glantz SA, editor. _Primer of biostatistics_,
3rd ed. New York: McGraw-Hill Corporation, 320–371. Google Scholar * Gu JW, Brady AL, Anand V, Moore MC, Kelly WC, and Adair TH (1999). Adenosine upregulates VEGF expression in cultured
myocardial vascular smooth muscle cells. _Am J Physiol_ 277: H595–602. CAS PubMed Google Scholar * Heid CA, Stevens J, Livak K, and Williams PM (1996). Real time quantitative PCR. _Genome
Res_ 6: 986–994. Article CAS PubMed Google Scholar * Holland PM, Abramson RD, Watson R, and Gelfand DH (1991). Detection of specific polymerase chain reaction product by utilizing the
5′ to 3′ exonuclease activity of _Thermus aquaicus_ DNA polymerase. _Proc Natl Acad Sci USA_ 88: 7276–7280. Article CAS PubMed PubMed Central Google Scholar * Horak ER, Leek R, Klenk N,
Le Jeune S, Smith K, and Stuart N (1992). Angiogenesis assessed by platelet/endothelial cell adhesion molecule antibodies as indicator of node metastases and survival in breast cancer.
_Lancet_ 340: 1120–1124. Article CAS PubMed Google Scholar * Ivan B, Olivi M, Champeme H, Vidaud D, Liderea R, and Vindaud M (1998). Novel approach to quantitative polymerase chain
reaction using real-time detection: Application to the detection of gene amplification in breast cancer. _Int J Cancer_ 78: 661–666. Article Google Scholar * Kellogg DE, Sninsky JJ, and
Kowk S (1990). Quantitation of HIV-1 proviral DNA relative to cellular DNA by the polymerase chain reaction. _Anal Biochem_ 189: 202–208. Article CAS PubMed Google Scholar * Longo N,
Berninger NS, and Hartley JL (1990). Use of uracil DNA glycosylase to control carry-over contamination in polymerase chain reaction. _Gene_ 93: 125–128. Article CAS PubMed Google Scholar
* Macchiarini P, Fontanini G, Jardin MJ, Squartini F, and Angelerti CA (1992). Relation of neovascularization to metastasis of non-small cell lung cancer. _Lancet_ 340: 145–146. Article
CAS PubMed Google Scholar * Mountain CF (1986). A new international staging system for lung cancer. _Chest_ 89: 225s–233s. Article CAS PubMed Google Scholar * Ohta Y, Ehdo Y, Tanaka M
., Shimizu J, Oda M, Hayashi Y, Watanabe Y, and Sasaki T (1996). Significance of vascular endothelial growth factor messenger RNA expression in primary lung cancer. _Clin Cancer Res_ 2:
1414–1416. Google Scholar * Ohta Y, Watanabe Y, Murakami S, Oda M, Hayashi Y, Nonomura A, Endo Y, and Sasaki T (1997). Vascular endothelial growth factor and lymph node metastasis in
primary lung cancer. _Br J Cancer_ 76: 1041–1045. Article CAS PubMed PubMed Central Google Scholar * Oshika Y, Nakamura M, todunaga T, Fukushima Y, Hatanaka H, Abe Y, Yamazaki H, Kijima
H, Tamaoki N, and Ueyama Y (1994). Expression of cell-associated isoform of vascular endothelial growth factor 189 and its prognostic relevance in non-small cell lung cancer. _Int J Oncol_
12: 541–544. Google Scholar * Piatak M Jr, Saag MS, Yang LC, Clark SJ, Kappes JC, Luk KC, Hahn BH, Shaw GM, and Lifson JD (1993). High levels of HIV-1 in plasma during all stages of
infection determined by competitive PCR. _Science_ 259: 1749–1754. Article CAS PubMed Google Scholar * Raeymaekers L (1995). A commentary on the practical application of competitive PCR.
_Genome Res_ 5: 91–94. Article CAS PubMed Google Scholar * Schor AM and Schor SC (1983). Tumor angiogenesis. _J Pathol_ 41: 385–413. Article Google Scholar * Srivasta A, Laidler P,
and Pavies RP (1988). The prognostic significance of tumor vascularity in intermediate thickness skin melanoma: A quantitative histologic study. _Am J Pathol_ 133: 419–423. Google Scholar *
Suzuki K, Hayashi N, Miyamoto Y, Yamamoto M, Ohkawa K, Ito Y, and Sasaki Y (1996). Expression of vascular permeability factor/vascular endothelial growth factor in human hepatocellular
carcinoma. _Cancer Res_ 56: 3004–3009. CAS PubMed Google Scholar * Takahashi Y, Kitadai Y, Bucana CD, Cleary RK, and Ellis LM (1995). Expression of vascular endothelial growth factor and
its receptor, KDR, correlates with vascularity, metastasis, and proliferation of human colon cancer. _Cancer Res_ 55: 3964–3968. CAS PubMed Google Scholar * Tokunaga T, Oshika Y, Oseki Y,
Sadahiro S, Kijima H, Tsuchida T, Yamazaki H, Ueyama Y, Tamaoki N, and Nakamura M (1998). Vascular endothelial growth factor (VEGF) mRNA isoform expression pattern is correlated with liver
metastasis and poor prognosis in colon cancer. _Brit J Cancer_ 77: 998–1002. Article CAS PubMed PubMed Central Google Scholar * Viglietto G, Romane A, Maglione D, Rambaldi M, Paolem I,
Lago CT, Califano D, Monaco C, Mineo A, Santelli G, and Manzo G (1996). Neovascularization in human germ cell tumors correlates with a marked increase in the expression of the vascular
endothelial growth factor but not the placenta-derived growth factor. _Oncogene_ 13: 577–587. CAS PubMed Google Scholar * Volm M, Koomangi R, and Mattern J (1997). Prognostic value of
vascular endothelial growth factor and its receptor Flt-1 in squamous cell lung cancer. _Int J Cancer_ 64: 64–68. Article Google Scholar * Weidner N, Semple JP, Welch WR, and Folkman J
(1991). Tumor angiogenesis and metastasis: Correlation in invasive breast carcinoma. _N Engl J Med_ 324: 1–8. Article CAS PubMed Google Scholar * Weiner N (1995). Intratumor microvessel
density as a prognostic factor in cancer. _Am J Pathol_ 147: 9–19. Google Scholar * WHO (1982). The World Health Organization histological typing of lung tumours. _Am J Clin Pathol_ 77:
123–136. * Yu CJ, She JY, Shun CT, Lin HT, Kuo SH, Luh KT, and Yang PC (1998). Quantitative analysis of mRNA encoding MUC1, MUC2, and MUC5AC: A correlation between specific mucin gene
expression and sialomucin expression in non-small cell lung cancer. _Am J Respir Cell Mol Biol_ 18: 643–652. Article CAS PubMed Google Scholar * Yuan A, Yang PC, Yu CJ, Lee YC, Yao YT,
Chen CL, Lee LN, Kuo SH, and Luh KT (1995). Tumor angiogensis correlates with histologic type and metastasis in non-small cell lung cancer. _Am J Respir Crit Care Med_ 152: 2157–2162.
Article CAS PubMed Google Scholar Download references AUTHOR INFORMATION AUTHORS AND AFFILIATIONS * Division of Chest Medicine, Department of Internal Medicine, National Taiwan
University Hospital, Taiwan Ang Yuan, Chong-Jen Yu & Pan-Chyr Yang * Division of Cardiovascular Medicine, Department of Internal Medicine, National Taiwan University Hospital, Taiwan
Wen-Jone Chen * Division of Cardiovascular Surgery, Department of Surgery, National Taiwan University Hospital, Taiwan Fang-Yue Lin * Department of Laboratory Medicine, National Taiwan
University Hospital, Taiwan Kwen-Tay Luh & Sow-Hsong Kuo Authors * Ang Yuan View author publications You can also search for this author inPubMed Google Scholar * Chong-Jen Yu View
author publications You can also search for this author inPubMed Google Scholar * Kwen-Tay Luh View author publications You can also search for this author inPubMed Google Scholar * Wen-Jone
Chen View author publications You can also search for this author inPubMed Google Scholar * Fang-Yue Lin View author publications You can also search for this author inPubMed Google Scholar
* Sow-Hsong Kuo View author publications You can also search for this author inPubMed Google Scholar * Pan-Chyr Yang View author publications You can also search for this author inPubMed
Google Scholar CORRESPONDING AUTHOR Correspondence to Pan-Chyr Yang. RIGHTS AND PERMISSIONS Reprints and permissions ABOUT THIS ARTICLE CITE THIS ARTICLE Yuan, A., Yu, CJ., Luh, KT. _et al._
Quantification of VEGF mRNA Expression in Non-Small Cell Lung Cancer Using a Real-Time Quantitative Reverse Transcription-PCR Assay and a Comparison with Quantitative Competitive Reverse
Transcription-PCR. _Lab Invest_ 80, 1671–1680 (2000). https://doi.org/10.1038/labinvest.3780177 Download citation * Received: 19 June 2000 * Published: 01 November 2000 * Issue Date: 01
November 2000 * DOI: https://doi.org/10.1038/labinvest.3780177 SHARE THIS ARTICLE Anyone you share the following link with will be able to read this content: Get shareable link Sorry, a
shareable link is not currently available for this article. Copy to clipboard Provided by the Springer Nature SharedIt content-sharing initiative