- Select a language for the TTS:
- UK English Female
- UK English Male
- US English Female
- US English Male
- Australian Female
- Australian Male
- Language selected: (auto detect) - EN
Play all audios:
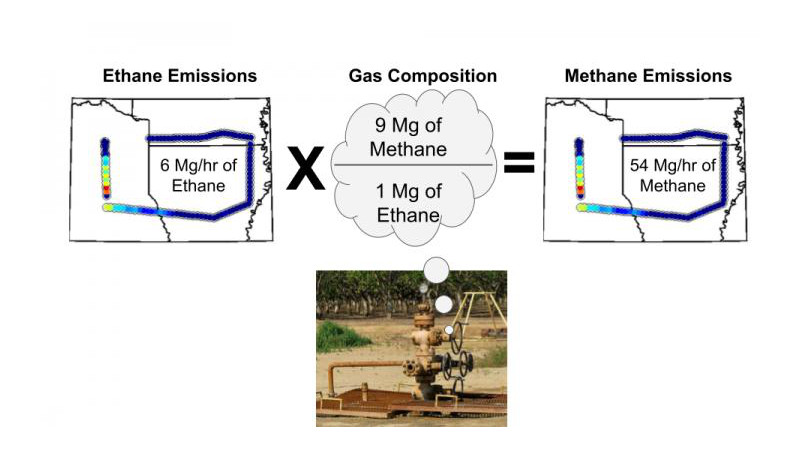
Measuring ethane in the atmosphere shows that the amounts of methane going into the atmosphere from oil and gas wells and contributing to greenhouse warming is higher than suggested by the
U.S. Environmental Protection Agency, according to an international team of scientists who spent three years flying over three areas of the U.S. during all four seasons. “Ethane is a gas
that is related only to certain sources of methane,” said Zachary R. Barkley, researcher in meteorology and atmospheric science, Penn State. “Methane, however, is produced by oil, gas and
coal fields, but also by cow’s digestive systems, wetlands, landfills and manure management. It is difficult to separate out fossil fuel produced and natural methane.” The Atmospheric Carbon
and Transport (ACT) America data made it possible to quantify methane emissions from oil, gas and coal sources, because the project measured not only methane, but also ethane. The
researchers note that methane identified with ethane can be reliably connected to fossil fuel sources, however, the ratio of ethane to methane does vary with individual sources. “ACT America
was conceived as an effort to improve our ability to diagnose the sources and sinks of global greenhouse gases, to improve the diagnosis,” said Kenneth J. Davis, professor of atmospheric
and climate science, Penn State. “We wanted to understand how greenhouse gases are moved around by weather systems in the atmosphere. Prior to ACT, there was no data to map out the
distribution of gases in weather systems.” From 2017 through 2019, researchers flew data collection missions over three portions of the U.S. — the central Atlantic states including
Pennsylvania, New York, Virginia, West Virginia and Maryland; the central southern states including Arkansas, Louisiana, Texas, Alabama, Oklahoma and Mississippi; and the central midwestern
states including Nebraska, South Dakota, Kansas, Minnesota, Iowa, Missouri, Wisconsin, Michigan, Ohio, Indiana and Illinois. The researchers covered all four seasons and tracked how weather
systems moved carbon dioxide, methane, ethane and other gases around in the atmosphere. The researchers are not the first to suggest that estimates of methane are too low, but according to
Barkley, they are the first to use ethane solely as a proxy. Ethane, although it will act as a greenhouse gas, only stays in the atmosphere for a few months before breaking down into other
compounds, rather than the 10 years that methane remains in the atmosphere. Ethane is more of a problem for air pollution than greenhouse warming. “We didn’t look at any of the methane data
at all and we still see the same results as everyone else,” he said. Another difference is that most previous airborne studies looked at small areas, emissions from single sites or fields.
ACT-America looked at multistate regions and encompassed over two-thirds of U.S. natural gas production. “Ethane data consistently exceeds values that would be expected based on (U.S.) EPA
Oil and gas leak rate estimates by more than 50%,” the researchers report in a recent issue of the _Journal of Geophysical Research: Atmospheres_. The researchers add that comparing the
combined fall, winter and spring ethane emission estimates to an inventory of oil and gas methane emissions, they estimate that the oil and gas methane emissions are larger than EPA
inventory values by 48% to 76%. The researchers used ethane-to-methane ratios from oil and gas production basins for this study. While carbon dioxide sources and sinks can be found across
the Earth’s surface, ethane and methane emissions come from specific locations on the ground that are known. Deserts and oceans and upland ecosystems emit little ethane or methane. Active
oil and gas fields have high emissions. When estimating trace gas emissions, researchers usually take their first best guess and then run multiple iterations to minimize the difference
between observed and simulated atmospheric concentrations of these gases. Barkley notes that sometimes signals are hard to interpret, but that that is not the case with this study. “The data
are there,” said Barkley. “The smaller plume in the model when increased by a factor of two suddenly matches the real time data.”