- Select a language for the TTS:
- UK English Female
- UK English Male
- US English Female
- US English Male
- Australian Female
- Australian Male
- Language selected: (auto detect) - EN
Play all audios:
ABSTRACT Agriculture is a major contributor to global greenhouse gas (GHG) emissions and must feature in efforts to reduce emissions. Organic farming might contribute to this through
decreased use of farm inputs and increased soil carbon sequestration, but it might also exacerbate emissions through greater food production elsewhere to make up for lower organic yields. To
date there has been no rigorous assessment of this potential at national scales. Here we assess the consequences for net GHG emissions of a 100% shift to organic food production in England
and Wales using life-cycle assessment. We predict major shortfalls in production of most agricultural products against a conventional baseline. Direct GHG emissions are reduced with organic
farming, but when increased overseas land use to compensate for shortfalls in domestic supply are factored in, net emissions are greater. Enhanced soil carbon sequestration could offset only
a small part of the higher overseas emissions. SIMILAR CONTENT BEING VIEWED BY OTHERS TECHNOLOGIES TO DELIVER FOOD AND CLIMATE SECURITY THROUGH AGRICULTURE Article 15 March 2021 GLOBAL
GREENHOUSE GAS EMISSIONS FROM ANIMAL-BASED FOODS ARE TWICE THOSE OF PLANT-BASED FOODS Article 13 September 2021 CONVENTIONAL AGRICULTURE INCREASES GLOBAL WARMING WHILE DECREASING SYSTEM
SUSTAINABILITY Article 04 November 2024 INTRODUCTION Organic farming is often suggested as a solution to the negative environmental effects of current food production1. Reduced farm inputs
and more soil carbon sequestration may alter local GHG budgets favourably. But this must be set against the need for increased production and associated land conversion elsewhere as a result
of lower crop and livestock yields under organic methods. Past studies of the potential of organic farming to mitigate GHG emissions have produced mixed results2. For example, Williams et
al.3 found that most organic cropping systems in England generate similar or greater GHG emissions per tonne of crop compared with conventional systems, with lower yields and increased rates
of nitrate leaching offsetting the lower use of inputs. Conversely, a Swiss study, which considered entire crop rotations and less-intensive modes of production than Williams et al.3, found
much lower GHG emissions per tonne of organic crop4. Studies comparing organic and non-organic livestock production have also yielded mixed results. In dairy production, reduced use of
inputs per tonne of milk under organic management is offset by lower milk yields and lower feed conversion ratios3,5. Whereas organic beef and sheep production systems can have greater
environmental efficiencies as a result of the replacement of manufactured nitrogen (N) fertiliser with biologically-fixed N from forage legumes6,7,8. In organic poultry production, reduced
productivities and low feed conversion ratios considerably reduce environmental efficiencies9,10,11. Similarly, organic pig production tends to have lower environmental efficiencies per
tonne of product due to lower stocking densities and less output per hectare12,13. Even where environmental efficiency per hectare is improved, organic systems require more land per tonne of
product as a result of lower yields: Williams et al.3 found additional land requirements of from 65 to 200%. The most recent attempt to quantify the GHG mitigation potential of organic
farming at a national scale was made by Audsley et al.14, who used a life-cycle assessment model (LCA) to compare UK organic and conventional data on commodity production, processing,
distribution, retail and trade. A ‘baseline’ LCA based assessment, reflecting actual consumption patterns, was compared with a range of scenarios, one of which was a transition to 100%
organic production. This built on a study by Jones and Crane15 in which the production impacts of a 100% conversion to organic agriculture in England and Wales were estimated using data on
organic yields, crop areas and livestock numbers from the Farm Business Survey. The results indicated that a switch to organic production in the UK could result in a GHG emission reduction
of about 8% in terms of UK production. However, the emissions associated with the additional land use changes overseas required to meet UK supply shortfalls were not considered. In an
earlier study16, we developed a model to estimate potential maximum food production from all agriculture—crops and livestock—in England and Wales under organic management. In this paper we
extend this analysis to estimate effects on national GHG balances. We assess the impacts of conversion of all agriculture to organic farming using the Agri-LCA models developed by Williams
et al.3 to estimate GHG emissions from individual agricultural systems. This includes carbon dioxide (CO2) emissions from fossil energy use in farm operations and in the production and
transport of farm inputs and outputs, as well as emissions of methane (CH4) and nitrous oxide (N2O) as functions of soil conditions, nutrient management and livestock variables (Methods). We
improved on the Audsley et al.14 assessment by also accounting for, first, limits to organic production imposed by the supply of livestock feed, rotational constraints and available N,
second, the GHG impact of overseas land use changes associated with increased food-imports, and third, the GHG offset potential of soil carbon (C) sequestration under organic production. We
also estimate uncertainties in our calculations using Monte Carlo analyses. In doing so we provide the most comprehensive national-scale assessment to-date of the potential land use,
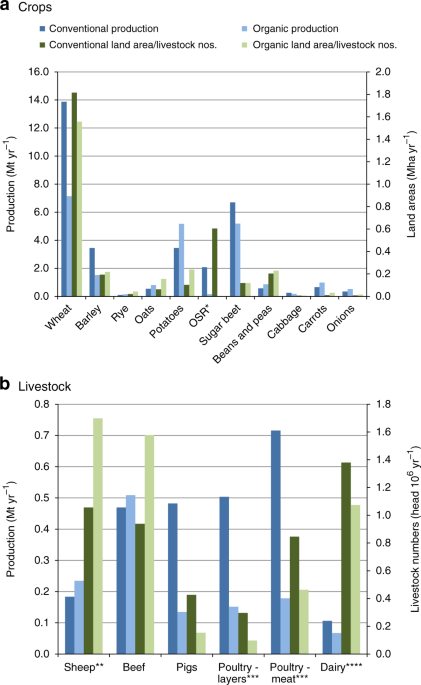
production and GHG impacts of up-scaling organic agriculture. RESULTS PREDICTED FOOD PRODUCTION We predict a drop in total food production expressed as metabolisable energy (ME) by of the
order of 40% compared to the conventional farming baseline (Fig. 1, Supplementary Table 1). Human edible protein outputs decreases by a similar proportion (Supplementary Table 2). The
decrease is due to smaller crop yields per unit of land area under organic management, and the need to introduce fertility-building grass leys with nitrogen-fixing legumes within crop
rotations. The latter requirement is a farming system-level effect that is not captured in crop-level comparisons16,17,18. Figure 1 also shows large shifts in the combination of crops grown
and numbers of animals reared. Increased diversity of crop rotations under organic management means total vegetable production is maintained16. Edible protein production increases in arable
areas, particularly in the east and north east of England, through increases in ruminant livestock and legume production16. Production of organic oilseed rape (OSR) decreases substantially,
primarily because of a much smaller cultivated area due to the relatively low yield of organic OSR compared to both conventional OSR and organic alternatives. The increase in legume and
potato production is a result of an increase in the cultivated area: legumes for biological N fixation and potatoes both for weed control and because of their high ME yield. The area would
have increased further had the constraint on maximum production in the model not been reached, which we set at 150% of current supply to reflect limits on consumer demand19,20. Total sugar
beet production decreased, but, due to its high ME yield, it reached its upper local limit in parts of eastern England, which we imposed to restrict expansion away from major processing
centres16. For most crops, the projected decreases in output are considerably greater than might be expected solely from the displacement of crops with leys in organic rotations. The
production of minor cereals, such as oats and rye, increases, but this is not sufficient to offset the losses of wheat and barley. Numbers of grazing livestock (sheep and beef cattle less
dairy) increase, because of the increase in feed availability from leys. But the volume of meat produced did not increase in proportion, as a result of lower carcass weights and longer
finishing times under organic management. Numbers of monogastric livestock (pigs and poultry) and associated meat production fell sharply as a result of lower stocking rates and availability
of concentrated feed. Dairy cattle numbers and milk production decrease due to greater reliance on concentrated feeds than grazing livestock and hence greater sensitivity to N availability,
cropping area and cereal yields. GHG EMISSIONS PER UNIT PRODUCTION Figure 2a shows estimated GHG emissions per unit of production for individual crops. The lower GHG emissions under organic
cropping are largely due to replacement of N fertiliser with biological N fixation in leys, resulting in less CO2 and N2O from fertiliser manufacture and less N2O per unit of
production3,4,21. We concentrate on N in our analysis, and not on other plant nutrients, because N is required in the greatest quantities and its inputs and outputs are the most sensitive to
differences between conventional and organic systems. However, balances of P, K and other nutrients must also be maintained, and we therefore account for the GHGs associated with extracting
and applying the P and K minerals commonly used in organic systems to maintain balances. Emissions per unit production are greater for some organic crops, such as field beans, due to
increased N leaching and nitrification-denitrification losses, because more must be grown on heavy wet soils. However, a large proportion of field beans grown would have to be exported
because of low rates of domestic consumption, and we allow for this in the model with a maximum limit on production, as for potatoes. Oats and spring barley, which require less manufactured
N fertiliser than other cereals, have greater GHG emissions per unit production under organic management because yields are smaller. Lower marketable yields in organic potato cropping also
lead to greater emissions per unit of product22. Emissions are also greater for organic crops requiring higher fossil fuel input in their cultivation, such as organic carrots requiring flame
weeding. Figure 2b shows emissions per unit of production for individual livestock types. Organic pig production results in lower GHG emissions per unit of production because outdoor
organic systems use less fossil energy in housing and there are no CH4 emissions from slurry storage; however, N2O emissions increase as a result of greater leaching and denitrification from
organic manures. In common with previous studies, we find that poultry meat and egg production generates greater emissions under organic management due to poorer feed conversion ratios,
longer rearing times, higher mortality rates and greater leaching losses compared to conventional free range and fully housed systems9,10. Organic dairy, beef and sheep production results in
lower total GHG emissions per unit of production, as a result of the increased efficiency of forage production under organic management, although greater forage intake increases the total
CH4 contribution. NATIONAL GHG EMISSIONS Figure 3 gives the aggregated national emissions. It shows that the direct emissions associated with organic crop (Fig. 3a) and livestock (Fig. 3c)
production are smaller for organic farming compared with conventional: by 20% for crops, 4% for livestock and 6% overall. This is a slightly lower estimate of the effect of conversion to
organic farming than in Audsley et al.’s study14. The decrease occurs despite an increase in transport emissions, illustrating the relatively small contribution that transport makes to
agriculture’s total GHG budget23. However, the picture is very different when we allow for, first, CO2 emissions from land use change overseas to make up for shortfalls in home production
under organic methods, and second, enhanced soil C sequestration under organic methods at home and overseas, as shown in Fig. 3b, and 3d for different ways of making these allowances. The
next two sections give our rationale for how we have done this. SOIL CARBON SEQUESTRATION Carbon sequestration rates are expected to be greater under organic farming because of greater use
of manures and slurry linked to more integrated management of livestock and crops, and longer crop rotations with leys involving forage legumes24. Although in conventional systems there is
generally a greater separation of livestock from crops, farmyard manures will mostly be applied to land somewhere, so the net transfer of C from the atmosphere to land would be about the
same25,26. On the other hand, excessive manure applications in livestock-dense areas under conventional management leads to over-fertilisation and suboptimal C sequestration27. Although we
found livestock production decreased under organic management, total livestock numbers were not much different and there was a substantial shift to grazing animals with 61% more sheep and
14% more cattle (beef plus dairy; Fig. 1). We estimate there would be approximately 12% more farmyard manure as a result (Supplementary Table 3). We estimate potential C sequestration under
organic management using rates of change in soil C derived from the National Soil Inventory of England and Wales for different land use classes by Kirk and Bellamy28, and assuming the change
from conventional to organic farming was equivalent to a change from continuous arable cropping to rotational grass (Methods). This gives sequestration rates of 0.28 Mg C ha−1 yr−1 for
arable land converted to rotational grass, or, after adjusting for the proportion of arable to arable plus rotational grass across England and Wales, 0.18 Mg C ha−1 yr−1. We used this as the
upper rate in the calculations for Fig. 3. For comparison, in a literature review of experiments comparing conventional and organic farming, Gattinger et al.24 found sequestration rates
between 0.07 and 0.45 Mg C ha−1 yr−1. However, most of these comparisons involved very high rates of external organic matter inputs to the organic systems, up to 4 times those under
conventional farming26. Given that we found only 12% more farmyard manure under organic farming, Gattinger et al.’s higher estimates are unrealistic. We therefore use Gattinger et al.’s24
lower value as the moderate rate in Fig. 3. It should be noted that the bulk of any C sequestration will be limited to the first decade or two following conversion, because any given soil
has a finite capacity to accumulate C depending on its characteristics and local environmental conditions25,29,30. A new steady-state soil C content will be reached after a few decades when
rates of decomposition in the soil at the higher C content match the increased rates of C inputs. OVERSEAS LAND CONVERSION We estimate that the land area needed to make up for shortfalls in
domestic production is nearly five times the current overseas land area used for food for England and Wales (Fig. 4). Total agricultural land-use is therefore 1.5 times greater than the
conventional baseline (combining domestic and overseas land). This is considerably greater than the 16–33% increase in land requirements projected in a recent study of global conversion to
organic farming31. The difference reflects the high conventional crop yields and livestock productivity in the UK compared with countries using less intensive, lower-yielding farming, and
the correspondingly greater production penalties in conversion to organic methods32. The consequences for net GHG emissions will depend on the nature of the land use change. If it entails
conversion of existing natural or semi-natural vegetation or pasture to crops, the cost will be greater than for increased production from existing arable land, which will have already lost
C compared with its original natural state, and which might be expected to sequester some C from the atmosphere under organic management. The emissions associated with land use changes will
apply over a similar period to the potential gains from enhanced soil C sequestration (i.e., a few decades). We compare three ways of assessing this and associated soil C sequestration:
first, if all the additional production is on land formerly under grass, with no associated C sequestration; second, if half the additional production is on land formerly under grass, with a
low rate of C sequestration; and third, if a quarter of the additional production is on land formerly under grass, with a high rate of C sequestration (Methods). In addition, there is the
opportunity cost of the amount of C that could be sequestered if the land were instead used to maximise its C storage potential, for example by converting it to productive forest. This
aspect is considered by Searchinger et al.35, who define a ‘Carbon Opportunity Cost’ (COC) as the amount of C that could be sequestered annually per kg of agricultural commodity if the land
were instead used to regenerate forest. We also calculated this (Methods). The results (Fig. 3b, d and Table 1) show that the net effects are sensitive to both the LUC scenario and the
degree of soil C sequestration. If all the LUC is by conversion of grassland with no C sequestration (the High scenario), net emissions increase by 56% over the conventional baseline.
Whereas, if only 25% of the LUC is from grassland, with a high rate of C sequestration (the Low scenario), net emissions are comparable to those in the conventional baseline. With 50% LUC
from grassland, and a moderate rate of C sequestration (the Medium scenario), the net increase is 21%. However, if the COC is added in, the net GHG costs of organic production are much
worse. For the Medium LUC and C sequestration scenario, adding in the COC (35.7 ± 6.6 Mt CO2e yr−1) gives a net increase in emissions over the conventional baseline of 1.7 times. DISCUSSION
The results show that widespread adoption of organic farming practices would lead to net increases in GHG emissions as a result of lower crop and livestock yields and hence the need for
additional production and associated land use changes overseas. It is not obvious how additional overseas land could be found, without expanding the existing area of tilled land by ploughing
up grassland. The global demand for food is expected to increase by 59–98% by 205034. Given that land resources are finite, this implies more competition for land, and more-intensive food
production per unit land area, whereas current organic systems are inherently less intensive. There are undoubted local environmental benefits to organic farming practices, including soil C
storage, reduced exposure to pesticides and improved biodiversity. However, these potential benefits need to be set against the requirement for greater production elsewhere. As well as
increased GHG emissions from compensatory changes in land use to make up for production shortfalls, there are substantial opportunity costs from reduced availability of land for other
purposes, such as greater C storage under natural vegetation35. Further, although organic systems may favour increased local biodiversity, habitat fragmentation under low-yielding organic
systems may mean global species diversity is in fact greater under land-sparing, high-yielding systems36,37. Could yields under organic management be improved to reduce land requirements?
Improvements in organic rotation design and more effective and reliable supplies of N from biological fixation are possibilities38,39. However, these improvements are probably marginal,
given the fundamental requirement for more leys in rotations under organic management. Given the much larger contribution of livestock farming to GHG emissions, a greater impact could be
gained from reduced meat consumption. Less livestock farming could release land for crops for human consumption and for other purposes such as C storage40. However, against this, global
trends are towards greater per capita and total meat consumption33. Also livestock can play important roles in local nutrient cycling and the provision of ecosystem services41,42. In
summary, our assessment of the impacts of a 100% conversion to organic farming in England and Wales has revealed that, whilst improvements in resource use efficiency could be obtained,
reduced outputs would mean that more imports would be required to maintain food supplies. This major expansion in agricultural cultivation overseas to make up for domestic supply shortfalls
would lead to increased GHG emissions from the associated land use changes. Ultimately it is unlikely that there exists any single optimal approach to achieving environmentally sustainable
food production. Therefore, context-specific evaluations are required to reveal the extent to which organic systems can contribute, alongside other approaches, to multi-objective and
internationally binding sustainability targets. METHODS THE OLUM The OLUM (Optimal Land Use Model)16 is a linear programming (LP) model that includes a suite of organic farming activities
that take place in nine Robust Farm Types: specialist cropping, mixed arable and livestock, specialist dairy, lowland grazing livestock, Less Favoured Area (LFA) grazing livestock, pigs and
poultry, and other. These cover the entire agricultural land-base in England and Wales. The Objective Function of the model, which is maximised subject to constraints on resource
availabilities, is the sum of total crop and livestock production, expressed as ME. Although human diets also need proteins, fats and nutrients, energy requirements are deemed to be a
primary driver of consumption and an inadequate food-energy intake is almost always accompanied by insufficient intake of nutrients37. The basic formulation of the OLUM is $$Z = \mathop
{\sum}\nolimits_{{ij} = 0}^{n} {C_{{ij}} \cdot x_{{ij}}\,{\mathrm{subject}}\,{\mathrm{to}}\,Rx_{{ij}} \le {\mathbf{b}},x_{{ij}} \ge 0},$$ (1) where \(Z\) is the objective function to be
maximised, _C__ij_ is the ME output (fresh weight per unit crop area or livestock number yr−1) of agricultural product _i_ on soil × rain class _j_, _x__ij_ is a scalar for the agricultural
activity (crop area or livestock number), _Rx__ij_ is a factor for the input and resource requirement associated with the agricultural activity, and B is a vector for resource endowment and
input availability (e.g., land by soil and rainfall class, and available soil N). Human dietary change is not considered. In each farm type, the set of crop and livestock production
activities available are fixed, as evidence suggests that the dominant agricultural activity (e.g., dairy farming) will usually stay in place post conversion to organic management, due to
existing farm infrastructure, farming knowledge and local conditions43. However, these activities can be individually expanded and contracted endogenously. The land areas under each farm
type are fixed, reflecting the areal coverage of their conventional equivalents recorded in the June Survey of Agriculture in 201044. A number of logical constraints are applied in the model
to reflect: the availability of land in the various soil/rainfall classes (next paragraph); maximum permissible area of crop groups (e.g., cereals, root crops) reflecting rotational
constraints; and upper limits on the total output of each crop, set at 150% of the current supply, following an assumption that further increases could not be absorbed by the market.
Rotational N availability limits are also imposed, as determined by crop and livestock-product offtake (from the land), N supply from various sources, such as biological fixation, imported
feed and atmospheric deposition, as well as manure-N availability in each region. We assume balances of P and K are maintained by applying P and K minerals commonly used in organic systems.
Livestock numbers and associated product output volumes are constrained by feed availability, as well as maximum and minimum stocking density constraints. Heavy, medium, light and humose
soil classes are defined with specified organic matter contents and pH values, and their spatial distribution across England and Wales in 5 km × 5 km grid squares were obtained from the
National Soil Inventory (www.LandIS.org.uk). Four rainfall classes are defined based on 30-year Meteorological Office annual rainfall data: dry 539–635 mm, medium 636–723 mm, wet 724–823 mm
and very wet 824–2500 mm. The total areas of each soil × rainfall combination were determined by identifying the dominant combination in each 5 km × 5 km grid square and allocating to that
combination the sum of the areas of each square, less any non-agricultural area. The OLUM produces a best estimate of production under fully organic agriculture in England and Wales,
assuming that food production would be maximised. To ensure that the results are reasonable, outputs are compared to the real-world distribution of conventional production in 2010 derived
from a range of industry sources (Supplementary Table 4), and to results from a previous study on the production impacts of a switch to organic farming in England and Wales15. THE AGRI-LCA
MODELS We assessed the environmental impacts of conversion to organic farming using the Cranfield Agri-LCA models for England and Wales3. Fossil energy use and emissions of CO2, CH4 and N2O
per tonne of each food commodity produced under given soil and management conditions are combined with official data on levels of production, to provide estimates of the total GHG impact of
agriculture. Results from earlier emissions analyses generated by these models for the current mix of agricultural systems in England and Wales are used as a comparator against which to
assess the organic conversion scenario. We adjust the following components of the Agri-LCA models to better reflect organic agriculture using data sources listed in Supplementary Table 4:
first, crop and grassland yields; second, crop cultivation practices and manure/compost application rates; third, crop and grassland areas by soil and rainfall type; fourth, livestock
productivity and mortality rates; and fifth, livestock diet compositions. Crop yield, cultivation and manure application data are adjusted for 12 main crops: wheat, barley, rye, oats,
potatoes, oilseed rape, sugar beet, beans and peas, cabbage, carrots, onions and forage maize. These cover 98% of the cultivated land in England and Wales44. All data sources used in this
exercise are provided in Supplementary Table 4. Crop and grassland areas under each of 16 soil and rainfall classes are derived from the OLUM results. The crop areas, by each soil and
rainfall class, are used in the Agri-LCA models to adjust N2O and CO2 impacts to reflect organic management. The functional units used in the LCA are tonnes of marketed crop-product. Organic
animal production data for the Agri-LCA are drawn from a range of industry sources to define, by livestock type: daily live-weight gain, annual fat-corrected milk yield, and feed conversion
ratios. Data are also input to the Agri-LCA on the composition of livestock diets, stocking rates per hectare and the proportion of livestock on upland and lowland. These values ensure that
feed intake meets the ME demand of livestock. Nitrogen excretion from livestock is derived from mass balances. Compound feed composition data are also applied to determine embedded impacts
of feed production overseas. Direct CH4 emissions from livestock are calculated as a function of dry matter intake (scaled in proportion to the forage dry matter intake), live-weight and
milk yields. The Agri-LCA livestock emissions estimates are based on six commodities: eggs, milk, sheep, beef, pig and poultry meat. Meat outputs are defined in terms of total dressed
carcass weight (tonnes), eggs by weight (tonnes) and milk output as fat-corrected litres3. SYSTEM BOUNDARIES AND ALLOCATION OF ENVIRONMENTAL BURDENS The downstream system boundary applied in
the Agri-LCA modelling is the farm gate, i.e., only resources consumed during the production of inputs and on-farm-based processes are considered (i.e., ‘from cradle to farm gate’2). The
GHG emissions associated with downstream activities—such as distribution, consumption and disposal of products produced on the farm—are not included. Some on-farm processing, such as grain
drying, milk cooling and potato storage, are included in the total impact assessment, as these operations are considered to be part of the on-farm production process3. Where multiple
products are derived from the same agricultural activity, such as grain and straw from cereals production, the GHG emissions from fossil energy use associated with the different components
are allocated on the basis of relative economic value and by system expansion with regard to manure (i.e., the manufactured N fertiliser avoided is discounted from the environmental burdens
associated with non-organic crops). Where economic allocation is used in the Agri-LCA, an organic price differential is applied. Emission factors are derived from IPCC 2006 estimates and
total emissions of CH4 and N2O converted to CO2 equivalents using their 100-year Global Warming Potentials (GWPs). The time-dependency of the GWP values introduces some uncertainty,
particularly for CH4 which has a 20-year GWP more than twice its 100-year value. However, allowing for this would introduce undue complexity. The emissions associated with animal feed
production are allocated to the livestock emission estimates, not those for crop production. IMPORTS AND EXPORTS The GHG emissions associated with producing imported food are allowed for in
the Agri-LCA models. We assume that any shortfall in supply from organic agriculture is made up by increased imports of organically produced commodities from overseas. We use data from
industry sources (Supplementary Table 5) to allocate imported product to the historic regions of origin of imports45. The GHG emissions associated with the transport of imports to England
and Wales is determined by multiplying the total volume of imported products by GHG coefficients derived from Hess et al.45. Transport burdens for imported sugar and sheep meat are derived
from Plassman et al.46 and Webb et al.23, respectively. Where the OLUM generates crop and livestock production in excess of domestic demand, the surpluses are assumed to be exported and the
GHG and fossil energy burdens associated with production of the exported commodities are subtracted from the total environmental burdens of organic agriculture. The same adjustment is made
to the GHG estimates of exports for conventional agriculture (see data sources for export volumes in Supplementary Table 5). Where the OLUM reduces production below the level of domestic
demand it is assumed that no exports occur, i.e., domestic consumption would take priority. Fossil energy use and GHG emissions associated with the production of oilseed rape, sugar beet,
wheat and lamb from non-European countries are derived from Pelletier et al.47, Tzilivakis et al.48 and Webb et al.23. The environmental burdens associated with crop and livestock products
sourced from Scotland, Northern Ireland and the rest of Europe are derived from the Agri-LCA, under the assumption that similar emissions and fossil energy use would occur in these systems3.
SOIL CARBON SEQUESTRATION We obtain an upper estimate of potential sequestration rates in organic systems based on rates of change of soil C measured in the National Soil Inventory (NSI) of
England and Wales49, as follows. Kirk and Bellamy28 summarised the NSI results by fitting to the data the simple single-pool model $$dC/dt = I - kC,$$ (2) where _C_ is the C content per
unit land surface area, _I_ is the rate of input from vegetation and other sources and _k_ is a rate constant for decomposition. They fitted Eq. (2) to the data for each NSI land use class
separately, omitting organic soils (which accounted for <5% of all the soils in the NSI) because their rates of change were less certain. The soil C content at steady state, when _dC/dt_
= 0, is equal to _I/k_. Soils with C contents greater than the steady-state value lose C; those with C contents less than it sequester C. We take the NSI class ‘rotational grass’ (i.e.,
grass that is sown and then tilled every few years as part of an arable rotation) to represent potential C contents under ideal organic management, and the class ‘arable’ to represent C
contents under conventional arable management. The mean soil C contents were 43.2 (_n_ = 552 sites) and 58.7 (_n_ = 301 sites) Mg C ha−1 under arable and rotational grass, respectively, and
the calculated steady-state C contents were 37.6 and 55.0 Mg C ha−1, respectively, indicating the rotational grass soils were on average close to steady state and their C contents therefore
represent maximum potential sequestration levels. The values of _I_ and _k_ for rotational grass were 2.54 Mg C ha−1 yr−1 and 0.046 yr−1, respectively (equivalent to negative emissions of
−9.3 and −0.17 Mg CO2 ha−1 yr−1). Substituting these values and the mean arable C content in Eq. (2) gives for the mean rate of sequestration on conversion from arable to rotational grass
((2.54 − 0.046 × 43.2) + 0)/2 = 0.28 Mg C ha−1 yr−1 (or −1.03 Mg CO2 ha−1 yr−1). After adjusting for the proportion of arable to arable plus rotational grass, the rate is 0.28 × 552/(552 +
301)=0.18 Mg C ha−1 yr−1 (or 0.66 Mg CO2 ha−1 yr−1). We use this as the high C sequestration rate in Fig. 3. We assume sequestration rates in established swards of permanent pasture or rough
grazing to be zero given that these sites will have already reached steady state. For comparison, in a literature survey of experiments comparing conventional and organic farming, Gattinger
et al.24 found sequestration rates between 0.07 and 0.45 Mg C ha−1. However, most of these comparisons involved very high rates of external organic matter inputs to the organic systems. The
average inputs were four times those under conventional farming for the full dataset and two times for systems with inputs equivalent to those from one European Livestock Unit (ELU) ha−1
26. We calculate that quantities of farmyard manure would be only approximately 12% greater under organic farming, as a result of greater numbers of grazing livestock (Supplementary Table
3). We therefore consider Gattinger et al.’s upper and middle sequestration estimates to be unrepresentative and take as the moderate sequestration rate in Fig. 3 their lower value of 0.07
Mg C ha−1 yr−1. Gains through C sequestration will be time-limited, because any given soil has a finite capacity to accumulate C and a new steady-state C content will be reached after a few
years, when increased C inputs are matched by increased losses at the greater soil C content. Our estimated sequestration rates therefore only apply in the early-years following conversion
to organic methods. Based on the NSI data, a new steady-state C content on conversion from arable to rotational grass would only be attained after (55.02 − 43.15)/0.28 = 42 years. ADDITIONAL
EMISSIONS FROM OVERSEAS LUC AND C SEQUESTRATION We estimate the additional overseas land area required for each of the food products listed in Fig. 1, produced organically, as follows. For
crops, we use first, regional yield data from Eurostat, second, organic crop yields from the recent meta-analysis by de Ponti et al.32 and third, results of an LCA for milling wheat grown in
Canada47. For livestock, we use first, regional yield data from Eurostat, second, results from the Agri-LCA3 and third, recent studies on the environmental burdens of imported lamb from New
Zealand23,50. The additional land area is calculated from the total overseas area required less the amount required for imports in the conventional baseline (based on the values in
Supplementary Table 6). The corresponding emissions are calculated as follows. We assume that woodland would not be converted for food production as this would conflict with the principles
of the International Federation of Organic Agriculture Movements (IFOAM)51. We calculate emissions from the conversion of grassland to crops from the area converted multiplied by LUC
emission estimates specified by the British Standards Institute for a range of countries52. Considering that not all the LUC would be from grassland, we compare three ways of assessing the
net emissions from overseas LUC and associated soil C sequestration, plus that of home production, as follows. First, High: all the additional land required is converted from grassland, with
no net soil C sequestration at home or overseas. Second, Medium: 50% of the additional arable land is converted from grassland, with a moderate rate of C sequestration (0.07 Mg C ha−1 yr−1)
at home and overseas. Third, Low: 25% of the additional arable land is converted from grassland, with a high rate of C sequestration (0.18 Mg C ha−1 yr−1) at home and overseas. Following
Searchinger et al.35, we also calculate the additional ‘carbon opportunity cost’ (COC) of using the land for agriculture as the quantity of C that could be sequestered annually if the
average productive capacity of land used to produce 1 kg of each food product globally were instead devoted to regenerating forest. We calculate the total COC from Searchinger et al.’s35 COC
factors per unit fresh weight of each food product (separating crops for human consumption from those used as animal feeds) multiplied by the additional fresh weight imports of each product
required to offset home production shortfalls. This is in addition to the emissions calculated under the LUC and C sequestration scenarios (1)–(3) above. This ‘C gain’ method—as opposed to
a ‘C loss’ method based on plant and soil C lost to date per unit food production—applies if it is only possible to increase C by re-establishing forests. UNCERTAINTY ANALYSIS Estimates of
uncertainty for each main commodity analysed were produced following the method of Wiltshire et al.53. Uncertainties were derived using Monte Carlo simulations with each domestically
produced crop commodity given an uncertainty estimate of 10% (i.e., in a triangular distribution with upper and lower bounds at 10% of the mean) and each domestically produced livestock
commodity at 15%. The emissions for crops and livestock were summed in separate Monte Carlo simulations to produce overall uncertainty estimates for each sector (as the standard deviation).
These were increased by 15% for all imported commodities en bloc. Emissions from import transportation were assumed to have a standard deviation of 10% of the mean53, i.e., the coefficient
of variation (CV) is 10%. The areas of land derived by the LP were assumed to have an error of 15%, which was applied to the whole solution, not per crop, given that all areas were derived
from any individual solution. Error bars on production area per crop (or livestock commodity) are thus not shown. The final emissions and uncertainty estimates for each production system
were derived from the sum of emissions from domestically produced crops and livestock together with emissions from imported crop and livestock production, together with their transport
emissions, based on supply chain data from Webb et al. (2013)23 and Williams et al. (2017)54. Estimates of the uncertainty from LUC were derived from Houghton55 and those from C
sequestration from Kirk and Bellamy28 for the upper rate and from Gattinger et al.24 for the medium and lowest rates. These were implemented as the uncertainty being a proportion of the
means that were applied to the LUC and C sequestration scenarios. These were established as having a CV of 17% for LUC55, which was increased for the carbon opportunity cost of Searchinger
et al.35 by a factor of 1.5 to allow for the extra uncertainty of the method (i.e., CV of 26%). The uncertainty of the high level of C sequestration was 86 and 24% for lower levels. The
uncertainty estimates for the sum of crop and livestock commodities, transport and land use change emissions and sequestration are summarised in Supplementary Table 7. These were used as
input values of uncertainties in the last stage to derive the overall uncertainties of each scenario. We tested the significance of differences in mean values, _z_, using Eq. (3)53 $$z =
\frac{{\left| {m_A - m_B} \right|}}{{\sqrt {CV_A^2 \times m_A^2 + CV_B^2 \times m_B^2} }} \times 100,$$ (3) where _m__A_ and _m__B_ are the means of systems A and B, respectively, and CV is
the CV of each mean (expressed as whole numbers). The threshold for a significant difference at the 5% level was _z_ ≥ 1.96. REPORTING SUMMARY Further information on research design is
available in the Nature Research Reporting Summary linked to this article. DATA AVAILABILITY The data underlying these calculations can be accessed at:
https://doi.org/10.6084/m9.figshare.6080333.v2. OLUM model code and data can be accessed at: https://tinyurl.com/yxlszsrv. The Agri-LCA models and data can be accessed at:
https://tinyurl.com/yy5jol7c REFERENCES * Helm, D. _Green and Prosperous Land: A Blueprint for Rescuing the British Countryside_ (William Collins, London, 2019). * Meier, M. S. et al.
Environmental impacts of organic and conventional agricultural products–Are the differences captured by life cycle assessment? _J. Environ. Manag._ 149, 193–208 (2015). Article Google
Scholar * Williams, A. G., Audsley, E. & Sandars, D. L. _Determining the Environmental Burdens and Resource Use in the Production of Agricultural and Horticultural Commodities_ (Defra,
London, 2006). * Nemecek, T., Dubois, D., Huguenin-Elie, O. & Gaillard, G. Life cycle assessment of Swiss farming systems: I. Integrated and organic farming. _Agric. Syst._ 104, 217–232
(2011). Article Google Scholar * Haas, G., Wetterich, F. & Köpke, U. Comparing intensive, extensified and organic grassland farming in southern Germany by process life cycle
assessment. _Agric. Ecosyst. Environ._ 83, 43–53 (2001). Article Google Scholar * Lynch, D., MacRae, R. & Martin, R. The carbon and global warming potential impacts of organic farming:
does it have a significant role in an energy constrained world? _Sustainability_ 3, 322–362 (2011). * Smith, L. G., Williams, A. G. & Pearce, B. D. The energy efficiency of organic
agriculture: a review. _Renew. Agric. Food Syst._ 30, 280–301 (2015). Article Google Scholar * Casey, J. & Holden, N. Greenhouse gas emissions from conventional, agri-environmental
scheme, and organic Irish suckler-beef units. _J. Environ. Qual._ 35, 231–239 (2006). Article CAS Google Scholar * Leinonen, I., Williams, A. G., Wiseman, J., Guy, J. & Kyriazakis, I.
Predicting the environmental impacts of chicken systems in the United Kingdom through a life cycle assessment: broiler production systems. _Poult. Sci._ 91, 8–25 (2012). Article CAS
Google Scholar * Leinonen, I., Williams, A. G., Wiseman, J., Guy, J. & Kyriazakis, I. Predicting the environmental impacts of chicken systems in the United Kingdom through a life cycle
assessment: egg production systems. _Poult. Sci._ 91, 26–40 (2012). Article CAS Google Scholar * Dekker, S., De Boer, I., Vermeij, I., Aarnink, A. & Koerkamp, P. G. Ecological and
economic evaluation of Dutch egg production systems. _Livest. Sci._ 139, 109–121 (2011). Article Google Scholar * Basset-Mens, C. & van der Werf, H. M. G. Scenario-based environmental
assessment of farming systems: the case of pig production in France. _Agric. Ecosyst. Environ._ 105, 127–144 (2005). Article Google Scholar * Van der Werf, H. M., Tzilivakis, J., Lewis, K.
& Basset-Mens, C. Environmental impacts of farm scenarios according to five assessment methods. _Agric. Ecosyst. Environ._ 118, 327–338 (2007). Article Google Scholar * Audsley, E.,
et al. _How Low Can We Go? An Assessment of Greenhouse Gas Emissions From the UK Food System and the Scope to Reduce Them by 2050_ (WWF-UK, Godalming, Surrey, UK, 2009). * Jones, P. &
Crane, R. _England and Wales under Organic Agriculture: How Much Food Could Be Produced?_ (University of Reading, Reading, UK, 2009). * Smith, L. G., Jones, P. J., Kirk, G. J. D., Pearce, B.
D. & Williams, A. G. Modelling the impact of a widespread conversion to organic agriculture in England and Wales. _Land Use Policy_ 76, 391–404 (2018). Article Google Scholar *
Ponisio, L. C. et al. Diversification practices reduce organic to conventional yield gap. _Proc. Natl Acad. Sci. USA_ 282, 20141396 (2015). Google Scholar * Connor, D. J. Organically grown
crops do not a cropping system make and nor can organic agriculture nearly feed the world. _Field Crop Res._ 144, 145–147 (2013). Article Google Scholar * Traill, W. et al. The potential
for competitive and healthy food chains of benefit to the countryside. _Trends Food Sci. Technol._ 19, 248–254 (2008). Article CAS Google Scholar * Macdiarmid, J. I., Douglas, F. &
Campbell, J. Eating like there’s no tomorrow: public awareness of the environmental impact of food and reluctance to eat less meat as part of a sustainable diet. _Appetite_ 96, 487–493
(2016). Article Google Scholar * Clark, M. & Tilman, D. Comparative analysis of environmental impacts of agricultural production systems, agricultural input efficiency, and food
choice. _Environ. Res. Lett_. 12, 064016 (2017). * Kniss, A. R., Savage, S. D. & Jabbour, R. Commercial crop yields reveal strengths and weaknesses for organic agriculture in the United
States. _PloS ONE_ 11, e0161673 (2016). Article Google Scholar * Webb, J., Adrian, A., Hope, E., Evans, D. & Moorhouse, E. Do foods imported into the UK have a greater environmental
impact than the same foods produced within the UK? _Int. J. Life Cycle Assess._ 18, 1325–1343 (2013). Article Google Scholar * Gattinger, A. et al. Enhanced top soil carbon stocks under
organic farming. _Proc. Natl Acad. Sci. USA_ 109, 18226–18231 (2012). Article CAS ADS Google Scholar * Powlson, D. S., Whitmore, A. P. & Goulding, K. W. T. Soil carbon sequestration
to mitigate climate change: a critical re-examination to identify the true and the false. _Eur. J. Soil Sci._ 62, 42–55 (2011). Article CAS Google Scholar * Leifeld, J. et al. Organic
farming gives no climate change benefit through soil carbon sequestration. _Proc. Natl Acad. Sci. USA_ 110, E984–E984 (2013). Article CAS Google Scholar * Sutton, M. A., et al. _The
European Nitrogen Assessment: Sources, Effects and Policy Perspectives_ (Cambridge University Press, UK, 2011). * Kirk, G. J. D. & Bellamy, P. H. Analysis of changes in organic carbon in
mineral soils across England and Wales using a simple single‐pool model. _Eur. J. Soil Sci._ 61, 406–411 (2010). Article CAS Google Scholar * Doetterl, S. et al. Soil carbon storage
controlled by interactions between geochemistry and climate. _Nat. Geosci._ 8, 780 (2015). Article CAS ADS Google Scholar * Tipping, E. et al. Long-term increases in soil carbon due to
ecosystem fertilization by atmospheric nitrogen deposition demonstrated by regional-scale modelling and observations. _Sci. Rep._ 7, 1890 (2017). Article CAS ADS Google Scholar * Muller,
A. et al. Strategies for feeding the world more sustainably with organic agriculture. _Nat. Commun._ 8, 1290 (2017). Article ADS Google Scholar * de Ponti, T., Rijk, B. & van
Ittersum, M. K. The crop yield gap between organic and conventional agriculture. _Agric. Ecosyst. Environ._ 108, 1–9 (2012). Google Scholar * Godfray, H. C. J., et al. Meat consumption,
health, and the environment. _Science_ 361, eaam5324 (2018). * Conijn, J. G., Bindraban, P. S., Schröder, J. J. & Jongschaap, R. E. E. Can our global food system meet food demand within
planetary boundaries? _Agric. Ecosyst. Environ._ 251, 244–256 (2018). Article CAS Google Scholar * Searchinger, T. D., Wirsenius, S., Beringer, T. & Dumas, P. Assessing the efficiency
of changes in land use for mitigating climate change. _Nature_ 564, 249–253 (2018). Article CAS ADS Google Scholar * Seufert, V., Ramankutty, N. & Foley, J. A. Comparing the yields
of organic and conventional agriculture. _Nature_ 485, 229–232 (2012). Article CAS ADS Google Scholar * Green, R. E., Cornell, S. J., Scharlemann, J. P. W. & Balmford, A. Farming and
the fate of wild nature. _Science_ 307, 550–555 (2005). * Smith, L. G. et al. Predicting the effect of rotation design on N, P, K balances on organic farms using the NDICEA model. _Renew.
Agric. Food Syst._ 31, 471–484 (2016). Article Google Scholar * Lassaletta, L., Billen, G., Grizzetti, B., Anglade, J. & Garnier, J. 50 year trends in nitrogen use efficiency of world
cropping systems: the relationship between yield and nitrogen input to cropland. _Environ. Res. Lett._ 9, 105011 (2014). Article ADS Google Scholar * Röös, E. et al. Protein futures for
Western Europe: potential land use and climate impacts in 2050. _Reg. Environ. Change_ 17, 367–377 (2017). Article Google Scholar * Herrero, M. et al. Smart Investments in sustainable food
production: revisiting mixed crop-livestock systems. _Science_ 327, 822–825 (2010). Article CAS ADS Google Scholar * Meemken, E. M. & Qaim, M. Organic Agriculture, Food Security,
and the Environment. _Ann. Rev. of Resour. Econ_. 10, 39–63 (2018). * Howlett, B., Connolly, L., Cowan, C., Meehan, H. & Nielsen, R. Conversion to Organic Farming: Case Study Report
Ireland (Teagasc, Dublin, 2002). * Defra. _June Survey of Agriculture and Horticulture_ (Defra, London, 2011). * Hess, T., Andersson, U., Mena, C. & Williams, A. The impact of healthier
dietary scenarios on the global blue water scarcity footprint of food consumption in the UK. _Food Policy_ 50, 1–10 (2015). Article Google Scholar * Plassmann, K. et al. Methodological
complexities of product carbon footprinting: a sensitivity analysis of key variables in a developing country context. _Environ. Sci. Policy_ 13, 393–404 (2010). Article CAS Google Scholar
* Pelletier, N., Arsenault, N. & Tyedmers, P. Scenario modeling potential eco-efficiency gains from a transition to organic agriculture: life cycle perspectives on Canadian canola,
corn, soy, and wheat production. _Environ. Manag._ 42, 989–1001 (2008). Article CAS ADS Google Scholar * Tzilivakis, J., Warner, D. J., May, M., Lewis, K. A. & Jaggard, K. An
assessment of the energy inputs and greenhouse gas emissions in sugar beet (Beta vulgaris) production in the UK. _Agric. Syst._ 85, 101–119 (2005). Article Google Scholar * Bellamy, P. H.,
Loveland, P. J., Bradley, R. I., Lark, R. M. & Kirk, G. J. D. Carbon losses from all soils across England and Wales 1978–2003. _Nature_ 437, 245–248 (2005). Article CAS ADS Google
Scholar * Barber, A. & Lucock, D. _Total Energy Indicators: Benchmarking Organic, Integrated and Conventional Beef Farms_ (AgriBusiness Group, New Zealand, 2006). * Lampkin, N. _et al_.
_The Role of Agroecology in Sustainable Intensification. Report for the Land Use Policy Group_ (The Organic Research Centre, Newbury, UK, 2015). * British Standards Institution. _PAS2050_:
_Specification for the Assessment of the Life Cycle Greenhouse Gas Emissions of Goods and Services_ (British Standards Institution, UK, 2011). * Wiltshire, J., et al. _Scenario Building to
Test and Inform the Development of a BSI Method for Assessing Greenhouse Gas Emissions From Food—PAS2050_ (Defra, London, 2009). * Williams, A. G., et al. _Assessing the Environmental
Impacts Of Healthier Diets. Final Report to Defra on Project FO0427_ (School of Water, Energy and Environment, Cranfield University, 2017). * Houghton, R. Revised estimates of the annual net
flux of carbon to the atmosphere from changes in land use and land management 1850–2000. _Tellus B Chem. Phys. Meteorol._ 55, 378–390 (2003). ADS Google Scholar Download references
ACKNOWLEDGEMENTS We thank the Soil Association, Vitrition Organic Feeds and AHDB for providing data for the land-use model. L.S. was supported by the Organic Research Centre, a PhD
studentship from the Engineering and Physical Sciences Research Council (EPSRC grant ref. WG17023N) and an education grant awarded by the Ratcliff Foundation. We thank Dr. Bruce Pearce at
the Organic Research Centre for his comments on an early draft of the paper. AUTHOR INFORMATION AUTHORS AND AFFILIATIONS * School of Water, Energy & Environment, Cranfield University,
Cranfield, MK43 0AL, UK Laurence G. Smith, Guy J. D. Kirk & Adrian G. Williams * School of Agriculture, Food and Environment, Royal Agricultural University, Cirencester, GL7 6JS, UK
Laurence G. Smith * School of Agriculture, Policy and Development, University of Reading, PO Box 237, Reading, RG6 6AR, UK Philip J. Jones Authors * Laurence G. Smith View author
publications You can also search for this author inPubMed Google Scholar * Guy J. D. Kirk View author publications You can also search for this author inPubMed Google Scholar * Philip J.
Jones View author publications You can also search for this author inPubMed Google Scholar * Adrian G. Williams View author publications You can also search for this author inPubMed Google
Scholar CONTRIBUTIONS L.S., P.J., A.W. and G.K. designed and developed the OLUM and LS carried the model simulations. A.W. developed the Agri-LCA models, provided an overview of their
function for use in this study and access to relevant data for the calculation of the environmental impacts. G.K. provided guidance on the calculation of the greenhouse gas emission offset
from carbon sequestration in organic systems. L.S. and G.K. wrote and revised the paper with help from all co-authors. CORRESPONDING AUTHOR Correspondence to Guy J. D. Kirk. ETHICS
DECLARATIONS COMPETING INTERESTS The authors declare no competing interests. ADDITIONAL INFORMATION PEER REVIEW INFORMATION _Nature Communications_ thanks Jorgen Olesen and Stephan Pfister
for their contribution to the peer review of this work. Peer reviewer reports are available. PUBLISHER’S NOTE Springer Nature remains neutral with regard to jurisdictional claims in
published maps and institutional affiliations. SUPPLEMENTARY INFORMATION SUPPLEMENTARY INFORMATION PEER REVIEW FILE REPORTING SUMMARY RIGHTS AND PERMISSIONS OPEN ACCESS This article is
licensed under a Creative Commons Attribution 4.0 International License, which permits use, sharing, adaptation, distribution and reproduction in any medium or format, as long as you give
appropriate credit to the original author(s) and the source, provide a link to the Creative Commons license, and indicate if changes were made. The images or other third party material in
this article are included in the article’s Creative Commons license, unless indicated otherwise in a credit line to the material. If material is not included in the article’s Creative
Commons license and your intended use is not permitted by statutory regulation or exceeds the permitted use, you will need to obtain permission directly from the copyright holder. To view a
copy of this license, visit http://creativecommons.org/licenses/by/4.0/. Reprints and permissions ABOUT THIS ARTICLE CITE THIS ARTICLE Smith, L.G., Kirk, G.J.D., Jones, P.J. _et al._ The
greenhouse gas impacts of converting food production in England and Wales to organic methods. _Nat Commun_ 10, 4641 (2019). https://doi.org/10.1038/s41467-019-12622-7 Download citation *
Received: 16 May 2018 * Accepted: 23 September 2019 * Published: 22 October 2019 * DOI: https://doi.org/10.1038/s41467-019-12622-7 SHARE THIS ARTICLE Anyone you share the following link with
will be able to read this content: Get shareable link Sorry, a shareable link is not currently available for this article. Copy to clipboard Provided by the Springer Nature SharedIt
content-sharing initiative


:max_bytes(150000):strip_icc():focal(745x72:747x74)/brittany-mahomes-then-vs-now-062223-tout-9bab7899eeae48c6877a4301ea9b7049.jpg)